29
/
en
AIzaSyAYiBZKx7MnpbEhh9jyipgxe19OcubqV5w
April 1, 2024
157675
Iran, Islamic Rep.
IRN
true
2
1
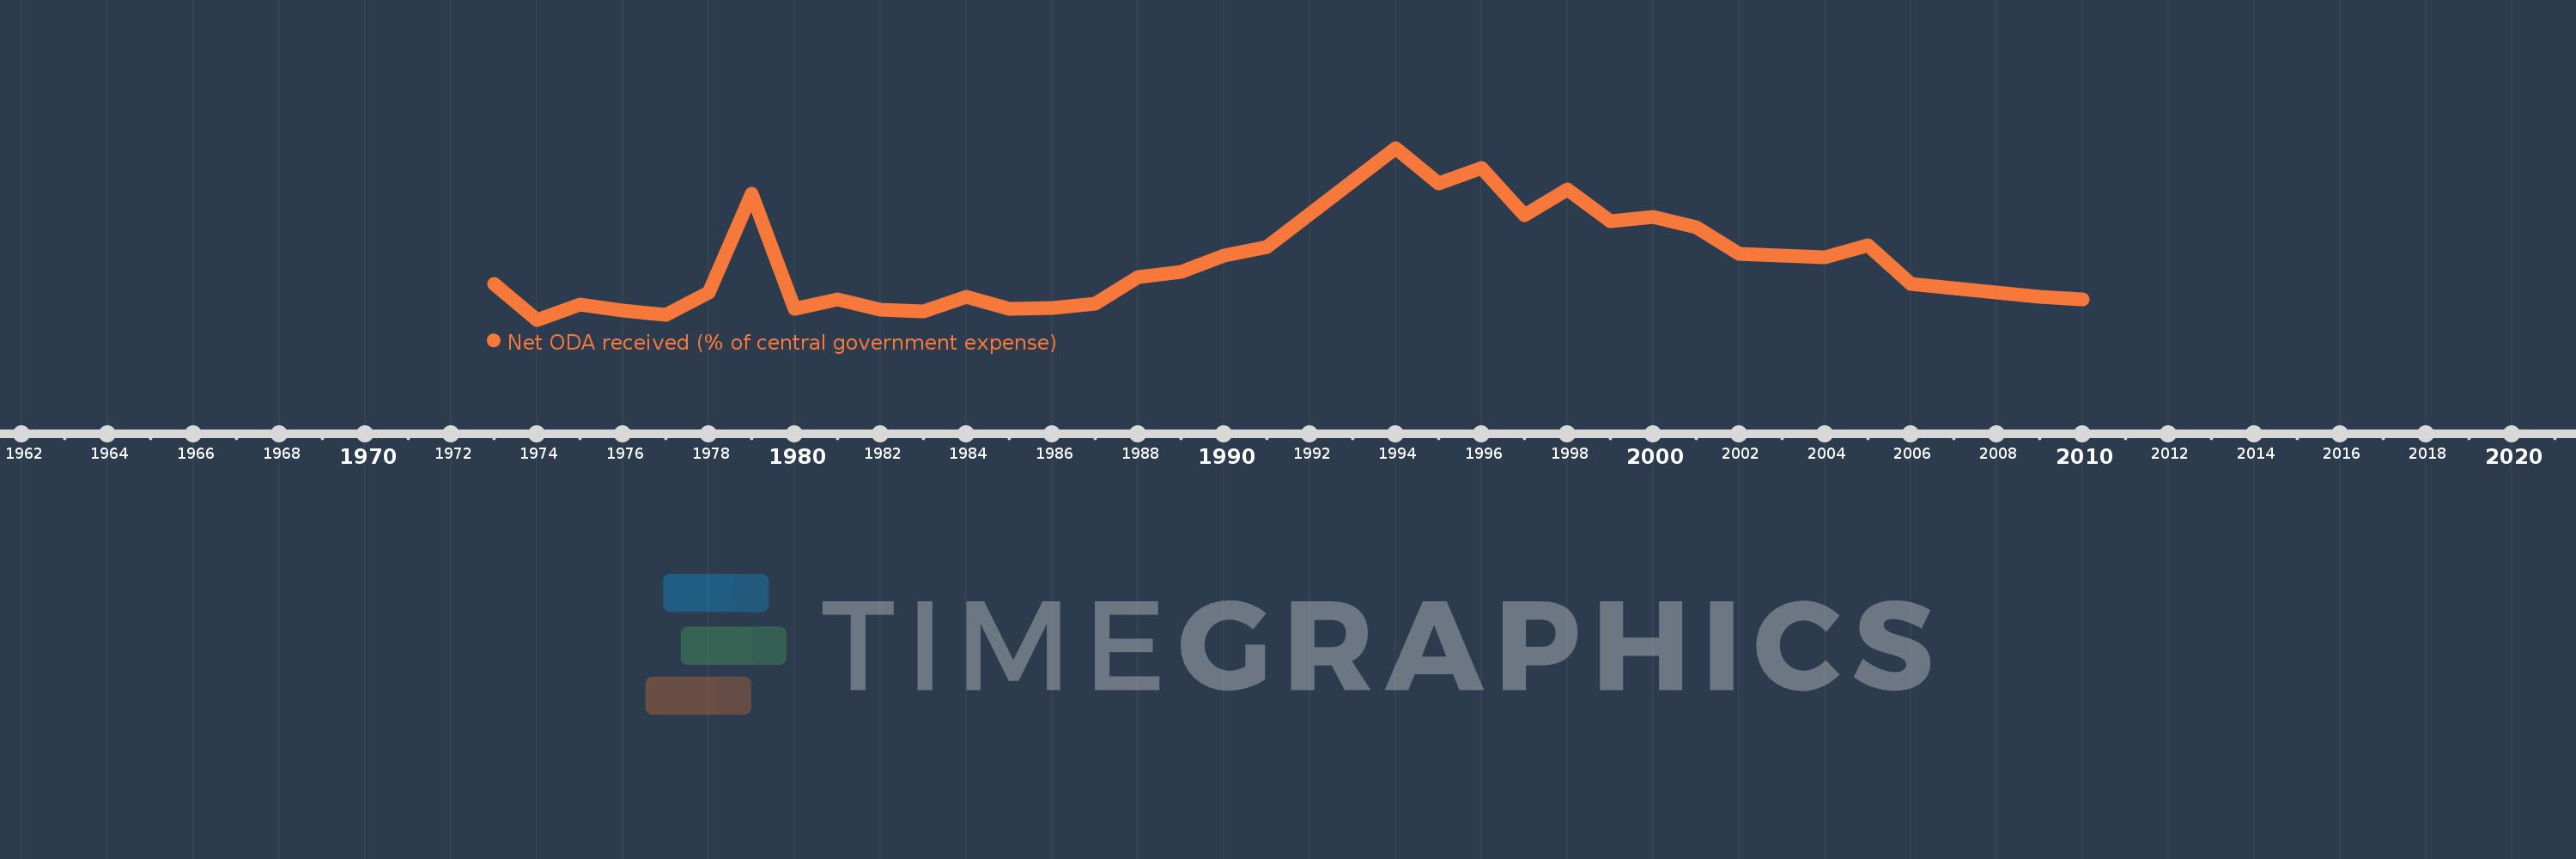
Net ODA received (% of central government expense)
2010,2009,2008,2007,2006,2005,2004,2003,2002,2001,2000,1999,1998,1997,1996,1995,1994,1991,1990,1989,1988,1987,1986,1985,1984,1983,1982,1981,1980,1979,1978,1977,1976,1975,1974,1973
This statistics in other country:
AfghanistanAlbaniaAlgeriaAngolaAntigua and BarbudaArmeniaAzerbaijanBahamas, TheBahrainBangladeshBarbadosBelarusBelizeBeninBhutanBoliviaBosnia and HerzegovinaBotswanaBrazilBurkina FasoBurundiCabo VerdeCambodiaCentral African RepublicChileColombiaCongo, Dem. Rep.Congo, Rep.Costa RicaCote d'IvoireCroatiaCyprusDominicaDominican RepublicEgypt, Arab Rep.El SalvadorEquatorial GuineaEthiopiaFijiGambia, TheGeorgiaGhanaGrenadaGuatemalaHondurasIndiaIndonesiaIran, Islamic Rep.IraqIsraelJamaicaJordanKazakhstanKenyaKiribatiKorea, Rep.KuwaitKyrgyz RepublicLao PDRLebanonLesothoLiberiaMacao SAR, ChinaMacedonia, FYRMadagascarMalawiMalaysiaMaldivesMaliMaltaMauritiusMexicoMicronesia, Fed. Sts.MoldovaMongoliaMoroccoMozambiqueMyanmarNamibiaNepalNicaraguaNigeriaOmanPakistanPanamaPapua New GuineaParaguayPeruPhilippinesRwandaSamoaSao Tome and PrincipeSenegalSerbiaSeychellesSierra LeoneSingaporeSloveniaSolomon IslandsSouth AfricaSri LankaSt. Kitts and NevisSt. LuciaSurinameSwazilandSyrian Arab RepublicTajikistanTanzaniaThailandTimor-LesteTogoTrinidad and TobagoTunisiaTurkeyUgandaUkraineUruguayVanuatuVenezuela, RBVietnamWest Bank and GazaYemen, Rep.ZambiaZimbabwe Timeline:
This timeline shows a graph from 1973 to 2010 of Iran, Islamic Rep.. No data until 1972. Number of actual observations by date: 36.
Source name:
World Development Indicators
Source organization:
Development Assistance Committee of the Organisation for Economic Co-operation and Development, Geographical Distribution of Financial Flows to Developing Countries, Development Co-operation Report, and International Development Statistics database. Data are available online at: www.oecd.org/dac/stats/idsonline. IMF central government expense estimates are used for the denominator.
Categories, topics:
Aid Effectiveness
Last updated:
apr 23, 2017
Indicators value changes by year
Minimum:
-0.075
jan 1, 1974
At the date of observation
Value
Absolute change
Change from previous value
jan 1, 1973
0.249
+0.249
0.0%
jan 1, 1974
-0.075
-0.324
-129.99%
jan 1, 1975
0.059
+0.134
-179.47%
jan 1, 1976
0.009
-0.051
-85.5%
jan 1, 1977
-0.027
-0.036
-416.48%
jan 1, 1978
0.172
+0.199
-729.53%
jan 1, 1979
1.064
+0.893
520.02%
jan 1, 1980
0.025
-1.039
-97.66%
jan 1, 1981
0.109
+0.084
337.26%
jan 1, 1982
0.018
-0.091
-83.76%
jan 1, 1983
-0.002
-0.02
-112.27%
jan 1, 1984
0.134
+0.137
-6.28K%
jan 1, 1985
0.026
-0.109
-80.72%
jan 1, 1986
0.035
+0.009
33.45%
jan 1, 1987
0.072
+0.038
108.58%
jan 1, 1988
0.315
+0.242
336.01%
jan 1, 1989
0.36
+0.046
14.52%
jan 1, 1990
0.505
+0.145
40.27%
jan 1, 1991
0.581
+0.076
15.1%
jan 1, 1994
1.482
+0.9
154.81%
jan 1, 1995
1.161
-0.32
-21.62%
jan 1, 1996
1.3
+0.139
11.98%
jan 1, 1997
0.873
-0.427
-32.86%
jan 1, 1998
1.103
+0.23
26.38%
jan 1, 1999
0.82
-0.283
-25.67%
jan 1, 2000
0.854
+0.034
4.15%
jan 1, 2001
0.76
-0.094
-11.02%
jan 1, 2002
0.519
-0.241
-31.73%
jan 1, 2003
0.509
-0.01
-1.88%
jan 1, 2004
0.494
-0.015
-2.94%
jan 1, 2005
0.603
+0.109
21.96%
jan 1, 2006
0.248
-0.355
-58.89%
jan 1, 2007
0.21
-0.038
-15.28%
jan 1, 2008
0.174
-0.036
-17.18%
jan 1, 2009
0.131
-0.043
-24.81%
jan 1, 2010
0.113
-0.018
-13.82%
Ranking of countries by current statistics by years


Comments: