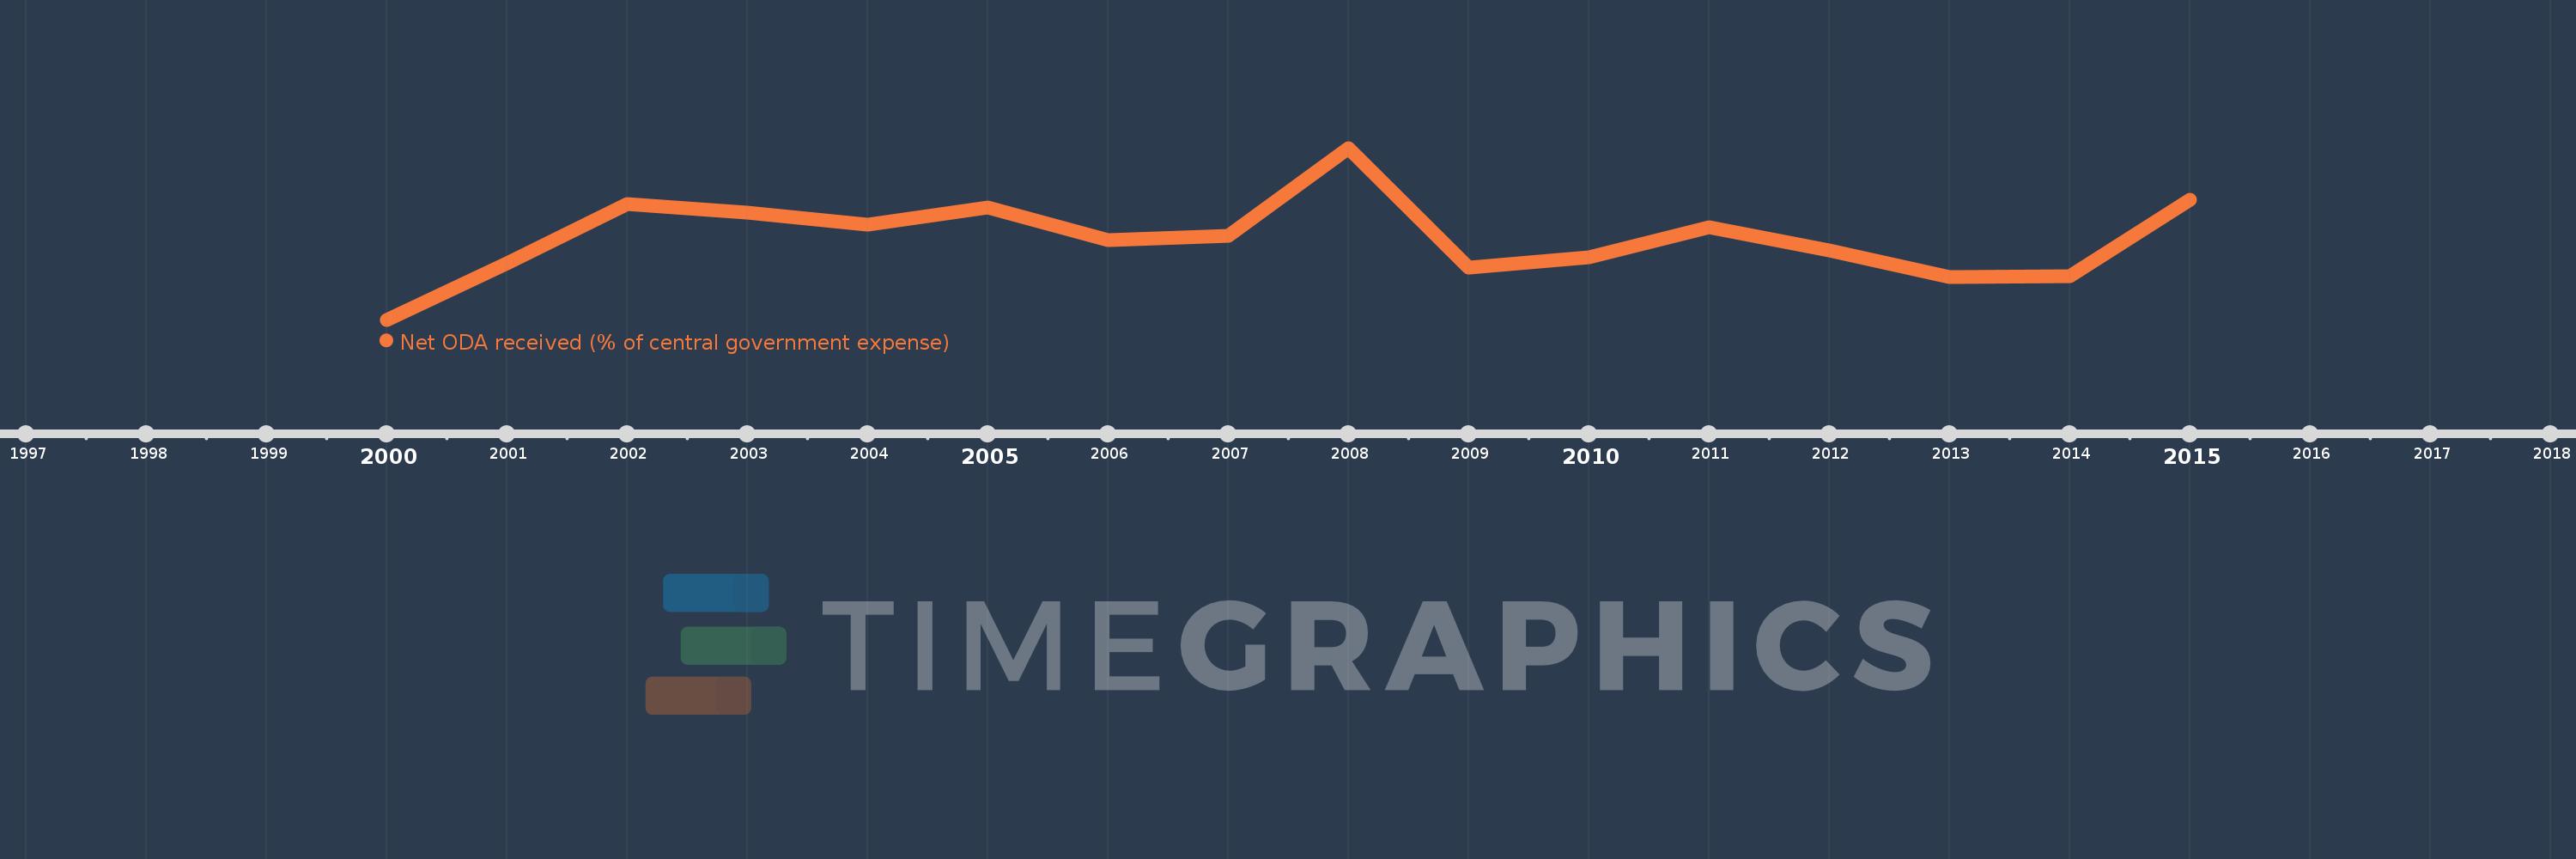
This timeline shows a graph from 2000 to 2015 of Sierra Leone. No data until 1999. Number of actual observations by date: 16.
Source name:
World Development Indicators
Source organization:
Development Assistance Committee of the Organisation for Economic Co-operation and Development, Geographical Distribution of Financial Flows to Developing Countries, Development Co-operation Report, and International Development Statistics database. Data are available online at: www.oecd.org/dac/stats/idsonline. IMF central government expense estimates are used for the denominator.
Categories, topics:
Aid Effectiveness
Last updated:
apr 23, 2017
Indicators value changes by year
Meaning:
120.795
Minimum:
50.015
jan 1, 2000
Maximum:
198.971
jan 1, 2008
At the date of observation
Value
Absolute change
Change from the previous value
jan 1, 2000
50.015
+50.015
0.0%
jan 1, 2001
98.842
+48.826
97.62%
jan 1, 2002
150.665
+51.823
52.43%
jan 1, 2003
143.023
-7.642
-5.07%
jan 1, 2004
132.346
-10.676
-7.46%
jan 1, 2005
147.723
+15.377
11.62%
jan 1, 2006
119.331
-28.393
-19.22%
jan 1, 2007
122.851
+3.52
2.95%
jan 1, 2008
198.971
+76.12
61.96%
jan 1, 2009
95.18
-103.791
-52.16%
jan 1, 2010
104.504
+9.324
9.8%
jan 1, 2011
130.045
+25.541
24.44%
jan 1, 2012
109.92
-20.126
-15.48%
jan 1, 2013
87.4
-22.52
-20.49%
jan 1, 2014
87.649
+0.249
0.29%
jan 1, 2015
154.259
+66.61
76.0%
Ranking of countries by current statistics by years
