29
/
en
AIzaSyAYiBZKx7MnpbEhh9jyipgxe19OcubqV5w
April 1, 2024
272649
Uganda
UGA
true
2
1
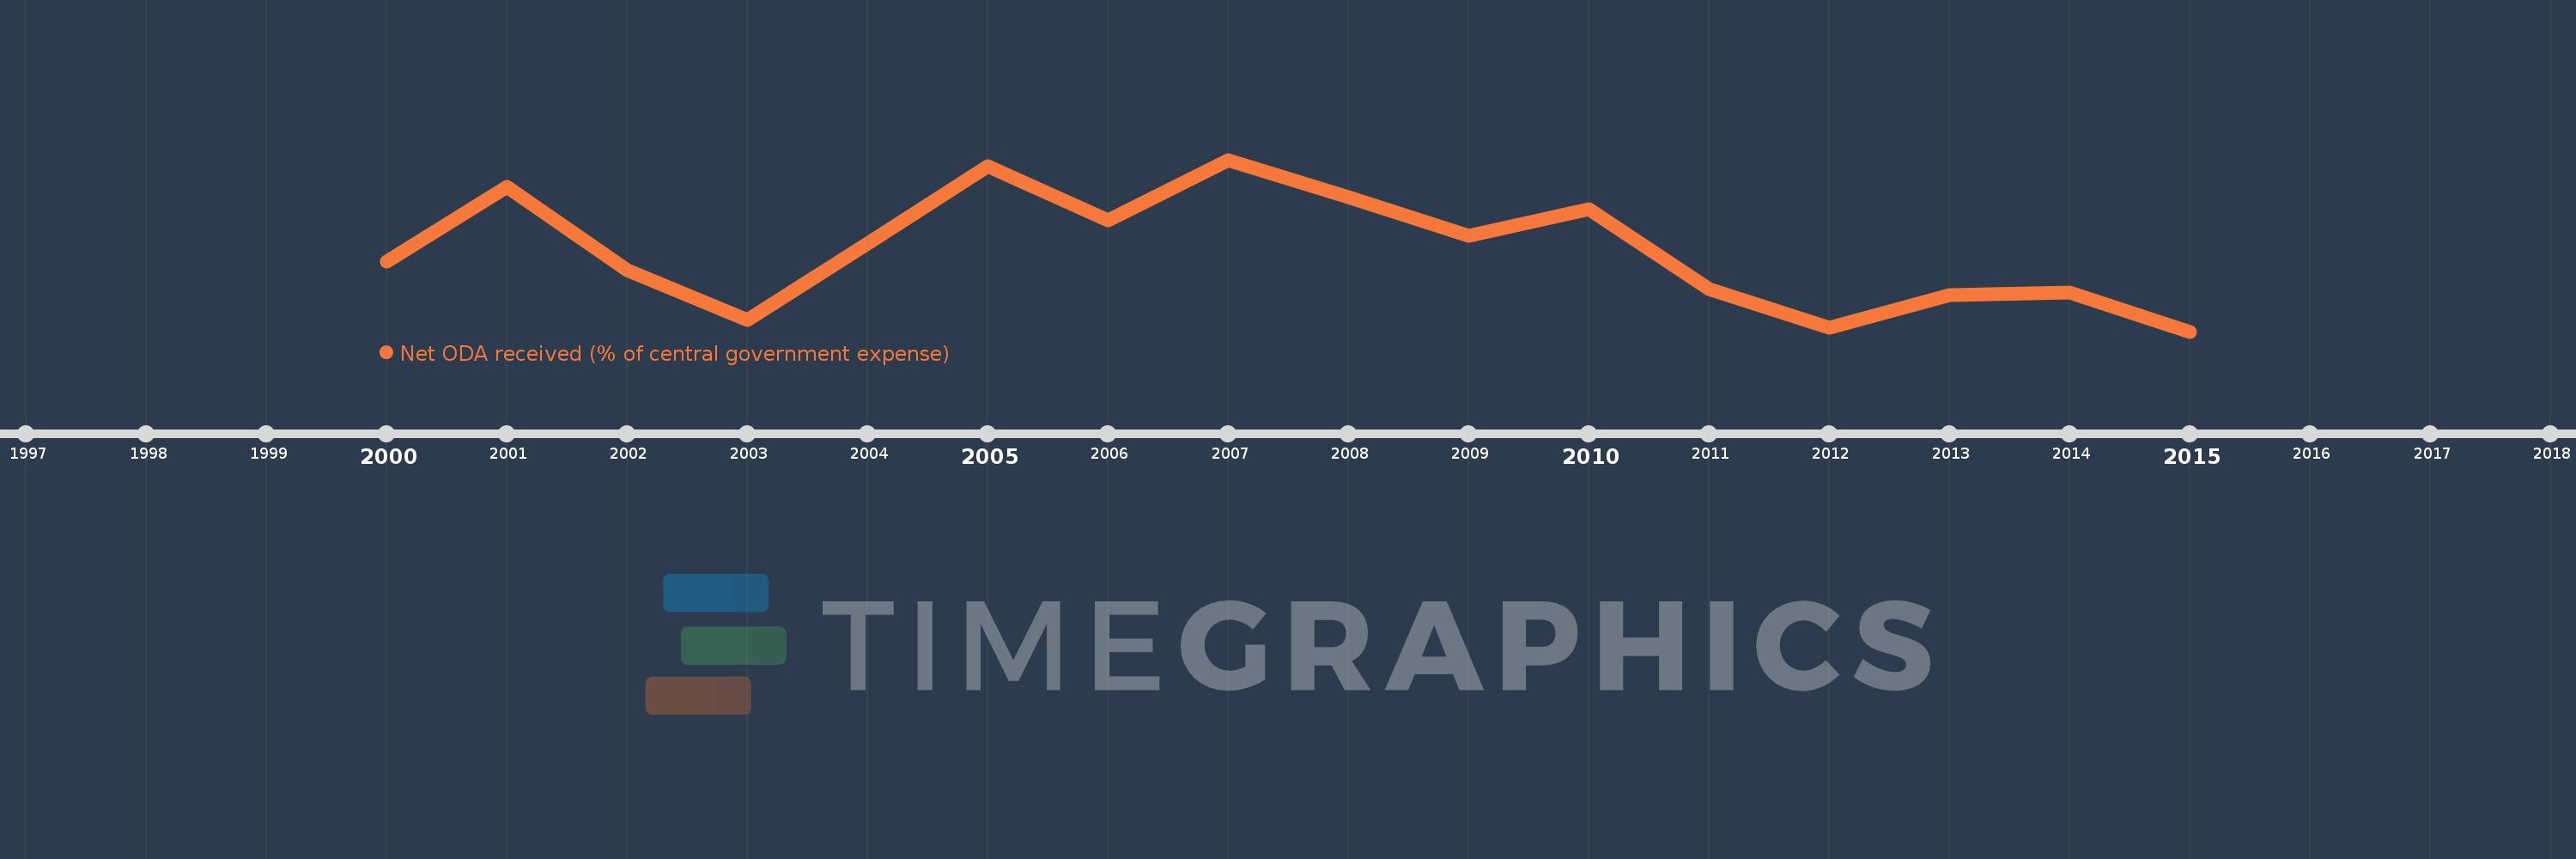
Net ODA received (% of central government expense)
2015,2014,2013,2012,2011,2010,2009,2008,2007,2006,2005,2004,2003,2002,2001,2000
This statistics in other country:
AfghanistanAlbaniaAlgeriaAngolaAntigua and BarbudaArmeniaAzerbaijanBahamas, TheBahrainBangladeshBarbadosBelarusBelizeBeninBhutanBoliviaBosnia and HerzegovinaBotswanaBrazilBurkina FasoBurundiCabo VerdeCambodiaCentral African RepublicChileColombiaCongo, Dem. Rep.Congo, Rep.Costa RicaCote d'IvoireCroatiaCyprusDominicaDominican RepublicEgypt, Arab Rep.El SalvadorEquatorial GuineaEthiopiaFijiGambia, TheGeorgiaGhanaGrenadaGuatemalaHondurasIndiaIndonesiaIran, Islamic Rep.IraqIsraelJamaicaJordanKazakhstanKenyaKiribatiKorea, Rep.KuwaitKyrgyz RepublicLao PDRLebanonLesothoLiberiaMacao SAR, ChinaMacedonia, FYRMadagascarMalawiMalaysiaMaldivesMaliMaltaMauritiusMexicoMicronesia, Fed. Sts.MoldovaMongoliaMoroccoMozambiqueMyanmarNamibiaNepalNicaraguaNigeriaOmanPakistanPanamaPapua New GuineaParaguayPeruPhilippinesRwandaSamoaSao Tome and PrincipeSenegalSerbiaSeychellesSierra LeoneSingaporeSloveniaSolomon IslandsSouth AfricaSri LankaSt. Kitts and NevisSt. LuciaSurinameSwazilandSyrian Arab RepublicTajikistanTanzaniaThailandTimor-LesteTogoTrinidad and TobagoTunisiaTurkeyUgandaUkraineUruguayVanuatuVenezuela, RBVietnamWest Bank and GazaYemen, Rep.ZambiaZimbabwe Timeline:
This timeline shows a graph from 2000 to 2015 of Uganda. No data until 1999. Number of actual observations by date: 16.
Source name:
World Development Indicators
Source organization:
Development Assistance Committee of the Organisation for Economic Co-operation and Development, Geographical Distribution of Financial Flows to Developing Countries, Development Co-operation Report, and International Development Statistics database. Data are available online at: www.oecd.org/dac/stats/idsonline. IMF central government expense estimates are used for the denominator.
Categories, topics:
Aid Effectiveness
Last updated:
apr 23, 2017
Indicators value changes by year
Minimum:
48.287
jan 1, 2015
Maximum:
96.212
jan 1, 2007
At the date of observation
Value
Absolute change
Change from previous value
jan 1, 2000
67.746
+67.746
0.0%
jan 1, 2001
88.741
+20.995
30.99%
jan 1, 2002
65.301
-23.44
-26.41%
jan 1, 2003
51.45
-13.851
-21.21%
jan 1, 2004
72.891
+21.441
41.67%
jan 1, 2005
94.378
+21.487
29.48%
jan 1, 2006
79.393
-14.985
-15.88%
jan 1, 2007
96.212
+16.819
21.18%
jan 1, 2008
85.851
-10.361
-10.77%
jan 1, 2009
75.111
-10.74
-12.51%
jan 1, 2010
82.527
+7.416
9.87%
jan 1, 2011
60.145
-22.382
-27.12%
jan 1, 2012
49.322
-10.823
-17.99%
jan 1, 2013
58.496
+9.174
18.6%
jan 1, 2014
59.119
+0.623
1.06%
jan 1, 2015
48.287
-10.832
-18.32%
Ranking of countries by current statistics by years


Comments: