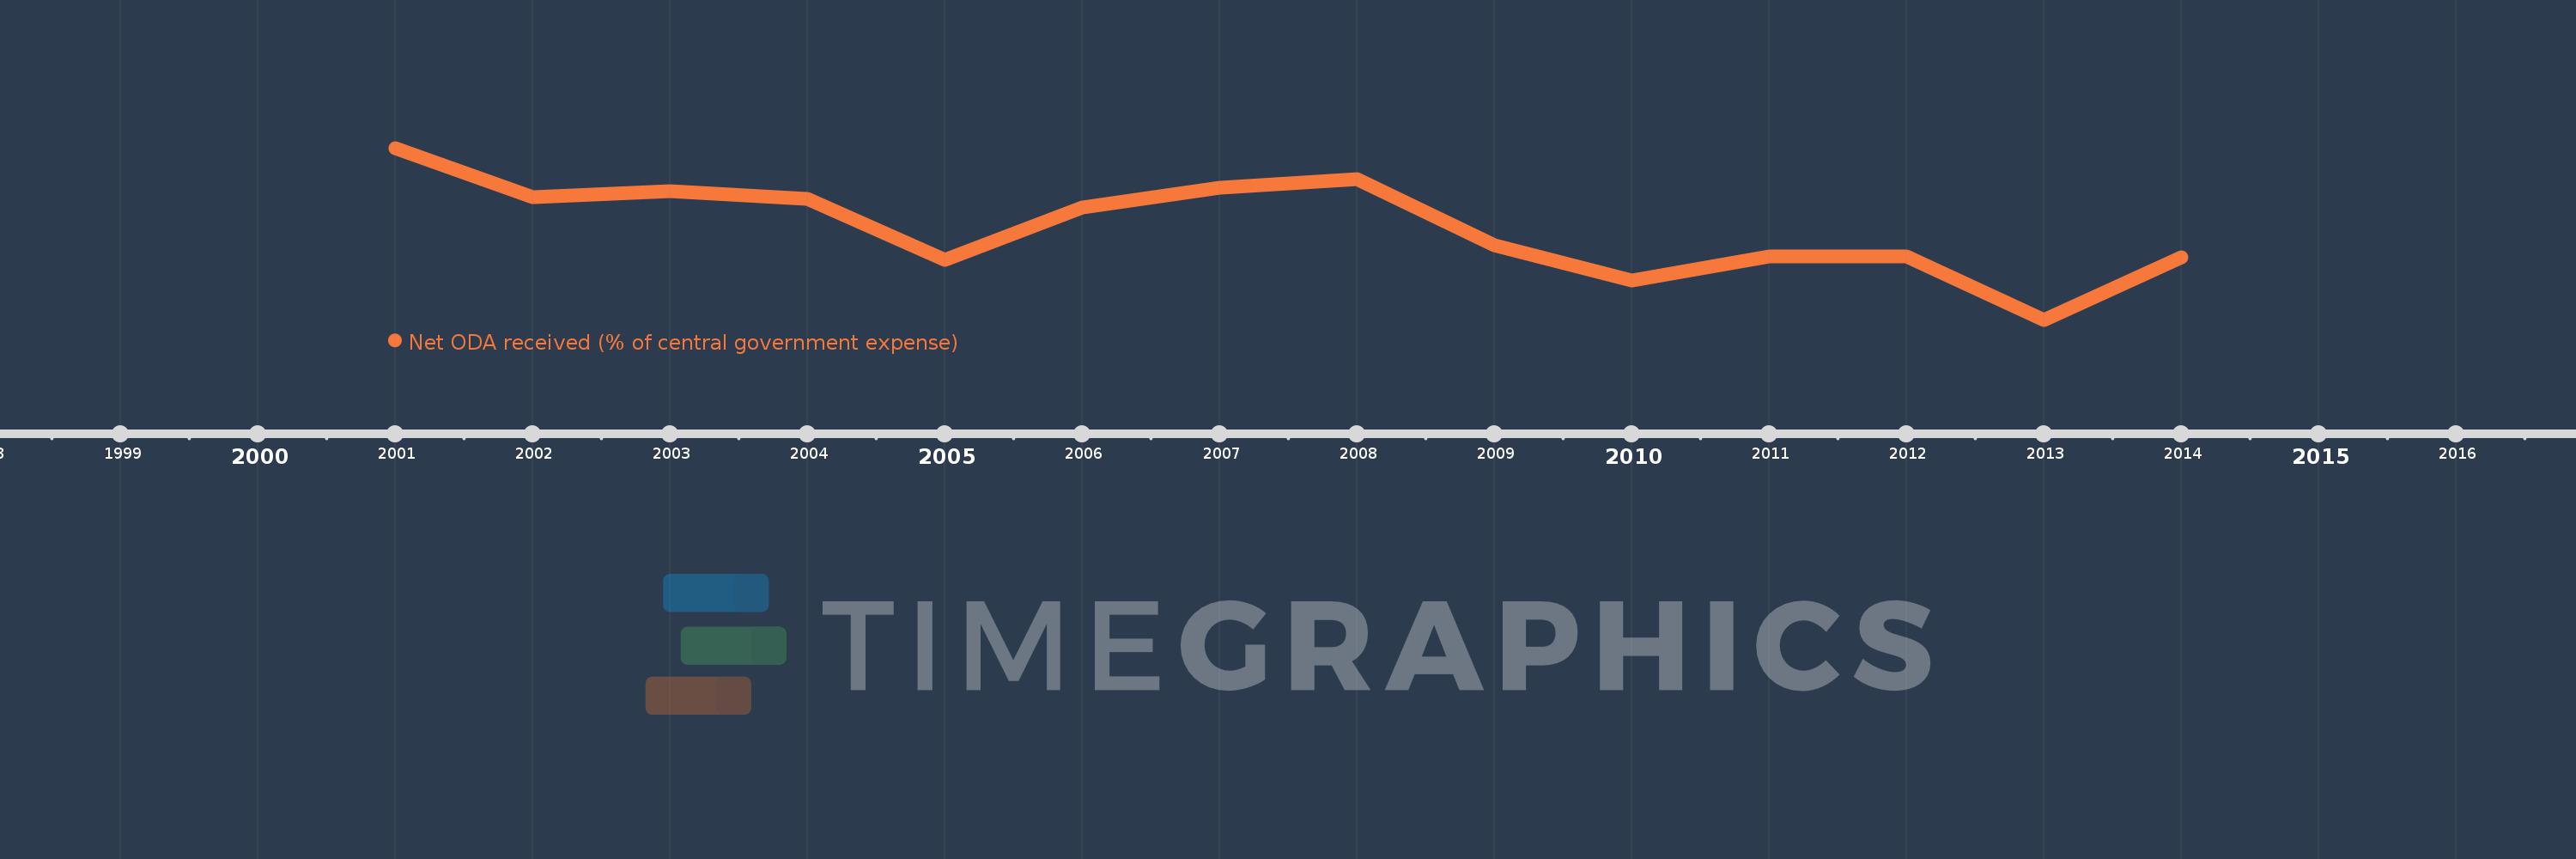
This timeline shows a graph from 2001 to 2014 of Mali. No data until 2000. Number of actual observations by date: 14.
Source name:
World Development Indicators
Source organization:
Development Assistance Committee of the Organisation for Economic Co-operation and Development, Geographical Distribution of Financial Flows to Developing Countries, Development Co-operation Report, and International Development Statistics database. Data are available online at: www.oecd.org/dac/stats/idsonline. IMF central government expense estimates are used for the denominator.
Categories, topics:
Aid Effectiveness
Last updated:
apr 23, 2017
Indicators value changes by year
Meaning:
85.841
Minimum:
66.622
jan 1, 2013
Maximum:
102.422
jan 1, 2001
At the date of observation
Value
Absolute change
Change from the previous value
jan 1, 2001
102.422
+102.422
0.0%
jan 1, 2002
92.179
-10.243
-10.0%
jan 1, 2003
93.469
+1.29
1.4%
jan 1, 2004
91.884
-1.585
-1.7%
jan 1, 2005
79.036
-12.848
-13.98%
jan 1, 2006
90.001
+10.966
13.87%
jan 1, 2007
94.098
+4.096
4.55%
jan 1, 2008
95.842
+1.744
1.85%
jan 1, 2009
82.119
-13.723
-14.32%
jan 1, 2010
74.891
-7.228
-8.8%
jan 1, 2011
79.783
+4.893
6.53%
jan 1, 2012
79.77
-0.014
-0.02%
jan 1, 2013
66.622
-13.147
-16.48%
jan 1, 2014
79.662
+13.04
19.57%
Ranking of countries by current statistics by years
