29
/
en
AIzaSyAYiBZKx7MnpbEhh9jyipgxe19OcubqV5w
April 1, 2024
253874
Suriname
SUR
true
2
1
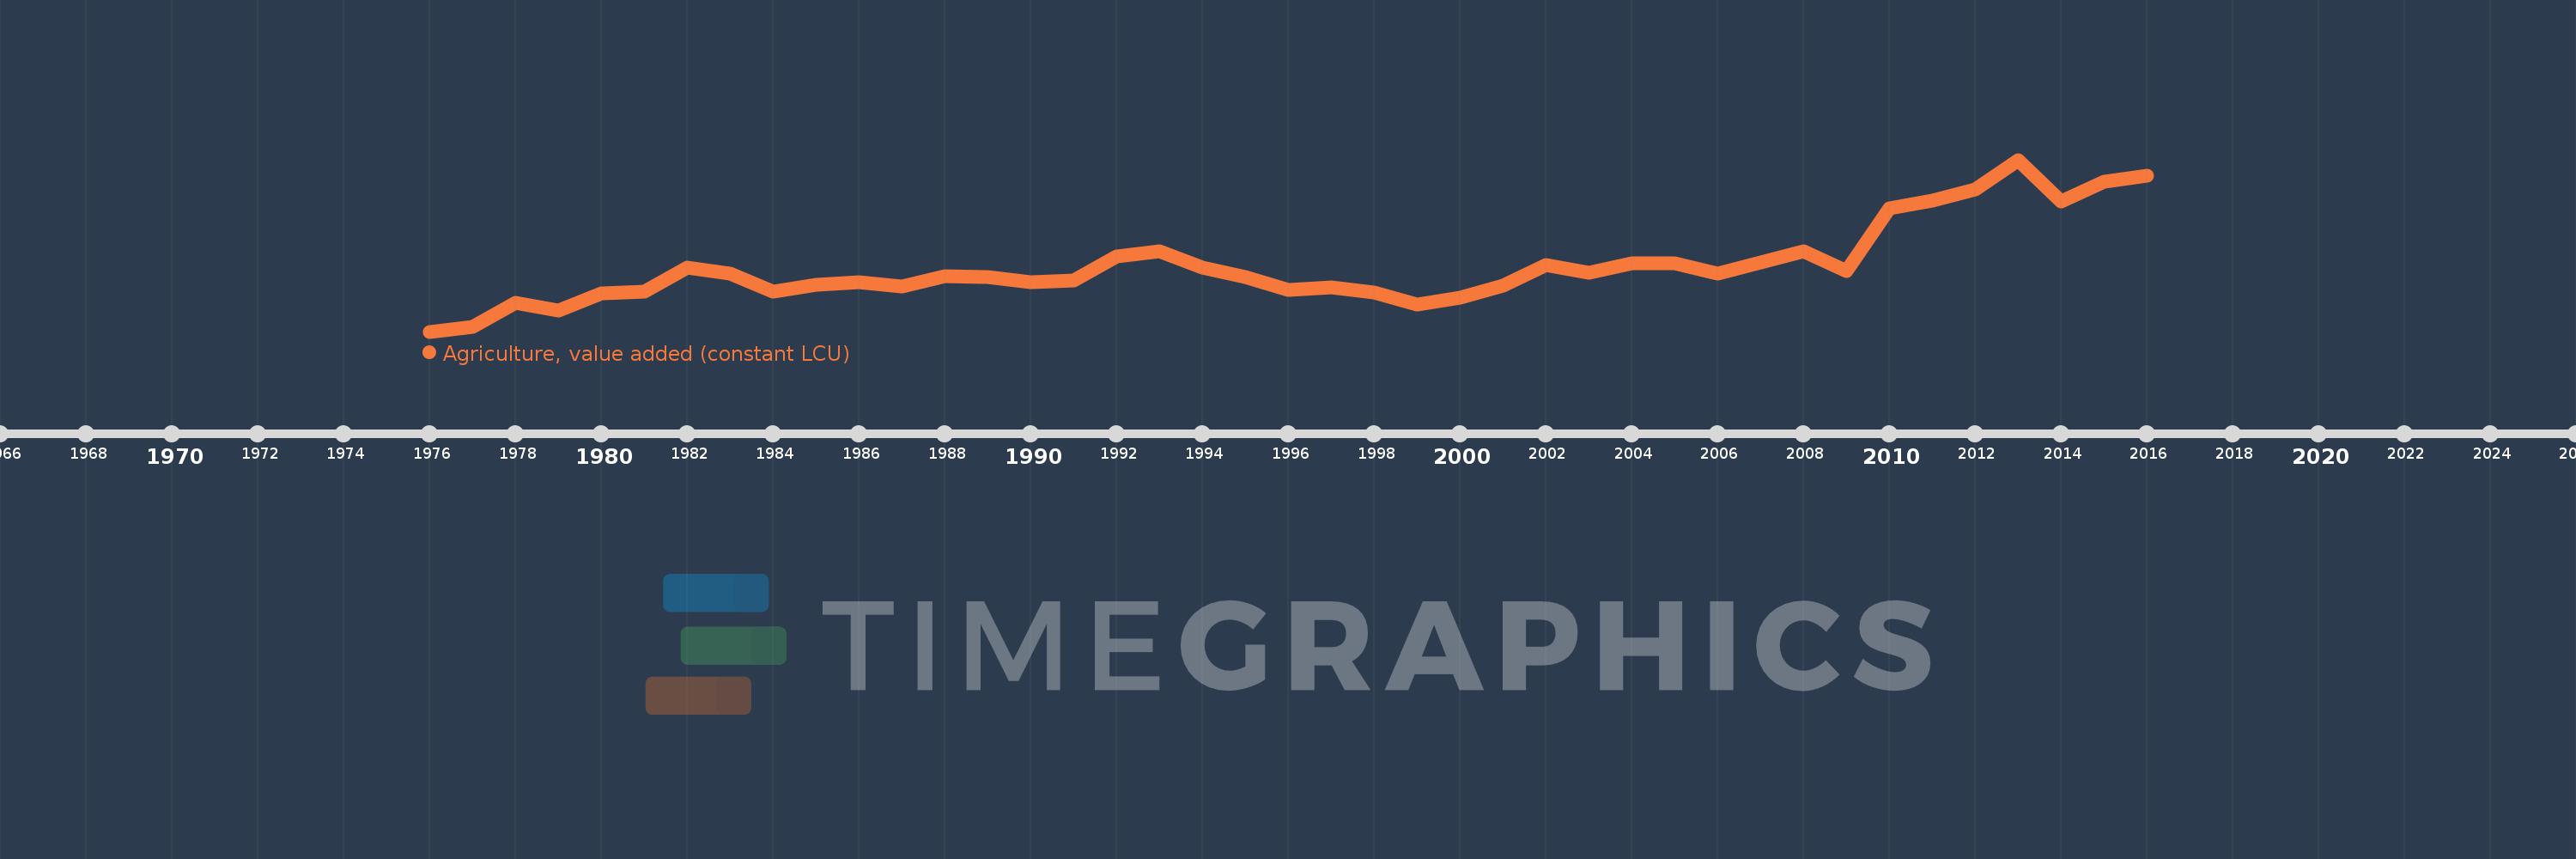
Agriculture, value added (constant LCU)
2016,2015,2014,2013,2012,2011,2010,2009,2008,2007,2006,2005,2004,2003,2002,2001,2000,1999,1998,1997,1996,1995,1994,1993,1992,1991,1990,1989,1988,1987,1986,1985,1984,1983,1982,1981,1980,1979,1978,1977,1976
This statistics in other country:
AfghanistanAlbaniaAlgeriaAntigua and BarbudaArgentinaArmeniaAustraliaAustriaAzerbaijanBahamas, TheBahrainBangladeshBelarusBelgiumBelizeBeninBermudaBhutanBoliviaBosnia and HerzegovinaBotswanaBrazilBrunei DarussalamBulgariaBurkina FasoBurundiCabo VerdeCambodiaCameroonCanadaCayman IslandsCentral African RepublicChadChileChinaColombiaComorosCongo, Dem. Rep.Congo, Rep.Costa RicaCote d'IvoireCroatiaCubaCyprusCzech RepublicDenmarkDjiboutiDominicaDominican RepublicEcuadorEgypt, Arab Rep.El SalvadorEquatorial GuineaEritreaEstoniaEthiopiaFijiFinlandFranceGabonGambia, TheGeorgiaGermanyGhanaGreeceGrenadaGuatemalaGuineaGuinea-BissauGuyanaHaitiHondurasHong Kong SAR, ChinaHungaryIcelandIndiaIndonesiaIran, Islamic Rep.IraqIrelandItalyJamaicaJapanJordanKazakhstanKenyaKiribatiKorea, Rep.KosovoKuwaitKyrgyz RepublicLao PDRLatviaLebanonLesothoLiberiaLithuaniaLuxembourgMacedonia, FYRMadagascarMalawiMalaysiaMaldivesMaliMarshall IslandsMauritaniaMauritiusMexicoMicronesia, Fed. Sts.MoldovaMongoliaMontenegroMoroccoMozambiqueMyanmarNamibiaNepalNetherlandsNew ZealandNicaraguaNigerNigeriaNorwayOmanPakistanPalauPanamaPapua New GuineaParaguayPeruPhilippinesPolandPortugalPuerto RicoQatarRomaniaRussian FederationRwandaSamoaSao Tome and PrincipeSaudi ArabiaSenegalSerbiaSeychellesSierra LeoneSingaporeSlovak RepublicSloveniaSolomon IslandsSomaliaSouth AfricaSpainSri LankaSt. Kitts and NevisSt. LuciaSt. Vincent and the GrenadinesSudanSurinameSwazilandSwedenSwitzerlandSyrian Arab RepublicTajikistanTanzaniaThailandTimor-LesteTogoTongaTrinidad and TobagoTunisiaTurkeyTurkmenistanTuvaluUgandaUkraineUnited Arab EmiratesUnited KingdomUnited StatesUruguayUzbekistanVanuatuVenezuela, RBVietnamWest Bank and GazaZambiaZimbabwe Timeline:
This timeline shows a graph from 1976 to 2016 of Suriname. No data until 1975. Number of actual observations by date: 41.
Source name:
World Development Indicators
Source organization:
World Bank national accounts data, and OECD National Accounts data files.
Categories, topics:
Economy & Growth
Last updated:
apr 23, 2017
Indicators value changes by year
Minimum:
537.743 mln
jan 1, 1976
Maximum:
1.173 bln
jan 1, 2013
At the date of observation
Value
Absolute change
Change from previous value
jan 1, 1976
537.743 mln
+537.743 mln
0.0%
jan 1, 1977
555.036 mln
+17.293 mln
3.22%
jan 1, 1978
643.73 mln
+88.694 mln
15.98%
jan 1, 1979
614.723 mln
-29.007 mln
-4.51%
jan 1, 1980
679.431 mln
+64.708 mln
10.53%
jan 1, 1981
684.451 mln
+5.02 mln
0.74%
jan 1, 1982
774.819 mln
+90.368 mln
13.2%
jan 1, 1983
751.39 mln
-23.429 mln
-3.02%
jan 1, 1984
685.567 mln
-65.823 mln
-8.76%
jan 1, 1985
711.785 mln
+26.218 mln
3.82%
jan 1, 1986
721.826 mln
+10.041 mln
1.41%
jan 1, 1987
703.417 mln
-18.408 mln
-2.55%
jan 1, 1988
741.907 mln
+38.49 mln
5.47%
jan 1, 1989
738.002 mln
-3.905 mln
-0.53%
jan 1, 1990
720.152 mln
-17.85 mln
-2.42%
jan 1, 1991
726.288 mln
+6.136 mln
0.85%
jan 1, 1992
816.496 mln
+90.208 mln
12.42%
jan 1, 1993
835.0 mln
+18.504 mln
2.27%
jan 1, 1994
774.861 mln
-60.139 mln
-7.2%
jan 1, 1995
740.166 mln
-34.695 mln
-4.48%
jan 1, 1996
691.593 mln
-48.573 mln
-6.56%
jan 1, 1997
702.233 mln
+10.64 mln
1.54%
jan 1, 1998
681.415 mln
-20.817 mln
-2.96%
jan 1, 1999
638.393 mln
-43.022 mln
-6.31%
jan 1, 2000
663.837 mln
+25.443 mln
3.99%
jan 1, 2001
707.784 mln
+43.947 mln
6.62%
jan 1, 2002
784.114 mln
+76.33 mln
10.78%
jan 1, 2003
756.357 mln
-27.756 mln
-3.54%
jan 1, 2004
788.74 mln
+32.382 mln
4.28%
jan 1, 2005
791.053 mln
+2.313 mln
0.29%
jan 1, 2006
751.731 mln
-39.321 mln
-4.97%
jan 1, 2007
792.0 mln
+40.269 mln
5.36%
jan 1, 2008
835.0 mln
+43.0 mln
5.43%
jan 1, 2009
761.0 mln
-74.0 mln
-8.86%
jan 1, 2010
993.0 mln
+232.0 mln
30.49%
jan 1, 2011
1.021 bln
+28.0 mln
2.82%
jan 1, 2012
1.065 bln
+44.0 mln
4.31%
jan 1, 2013
1.173 bln
+108.0 mln
10.14%
jan 1, 2014
1.02 bln
-153.0 mln
-13.04%
jan 1, 2015
1.092 bln
+72.0 mln
7.06%
jan 1, 2016
1.114 bln
+22.4 mln
2.05%
Ranking of countries by current statistics by years


Comments: