29
/
en
AIzaSyAYiBZKx7MnpbEhh9jyipgxe19OcubqV5w
April 1, 2024
233372
Sao Tome and Principe
STP
true
2
1
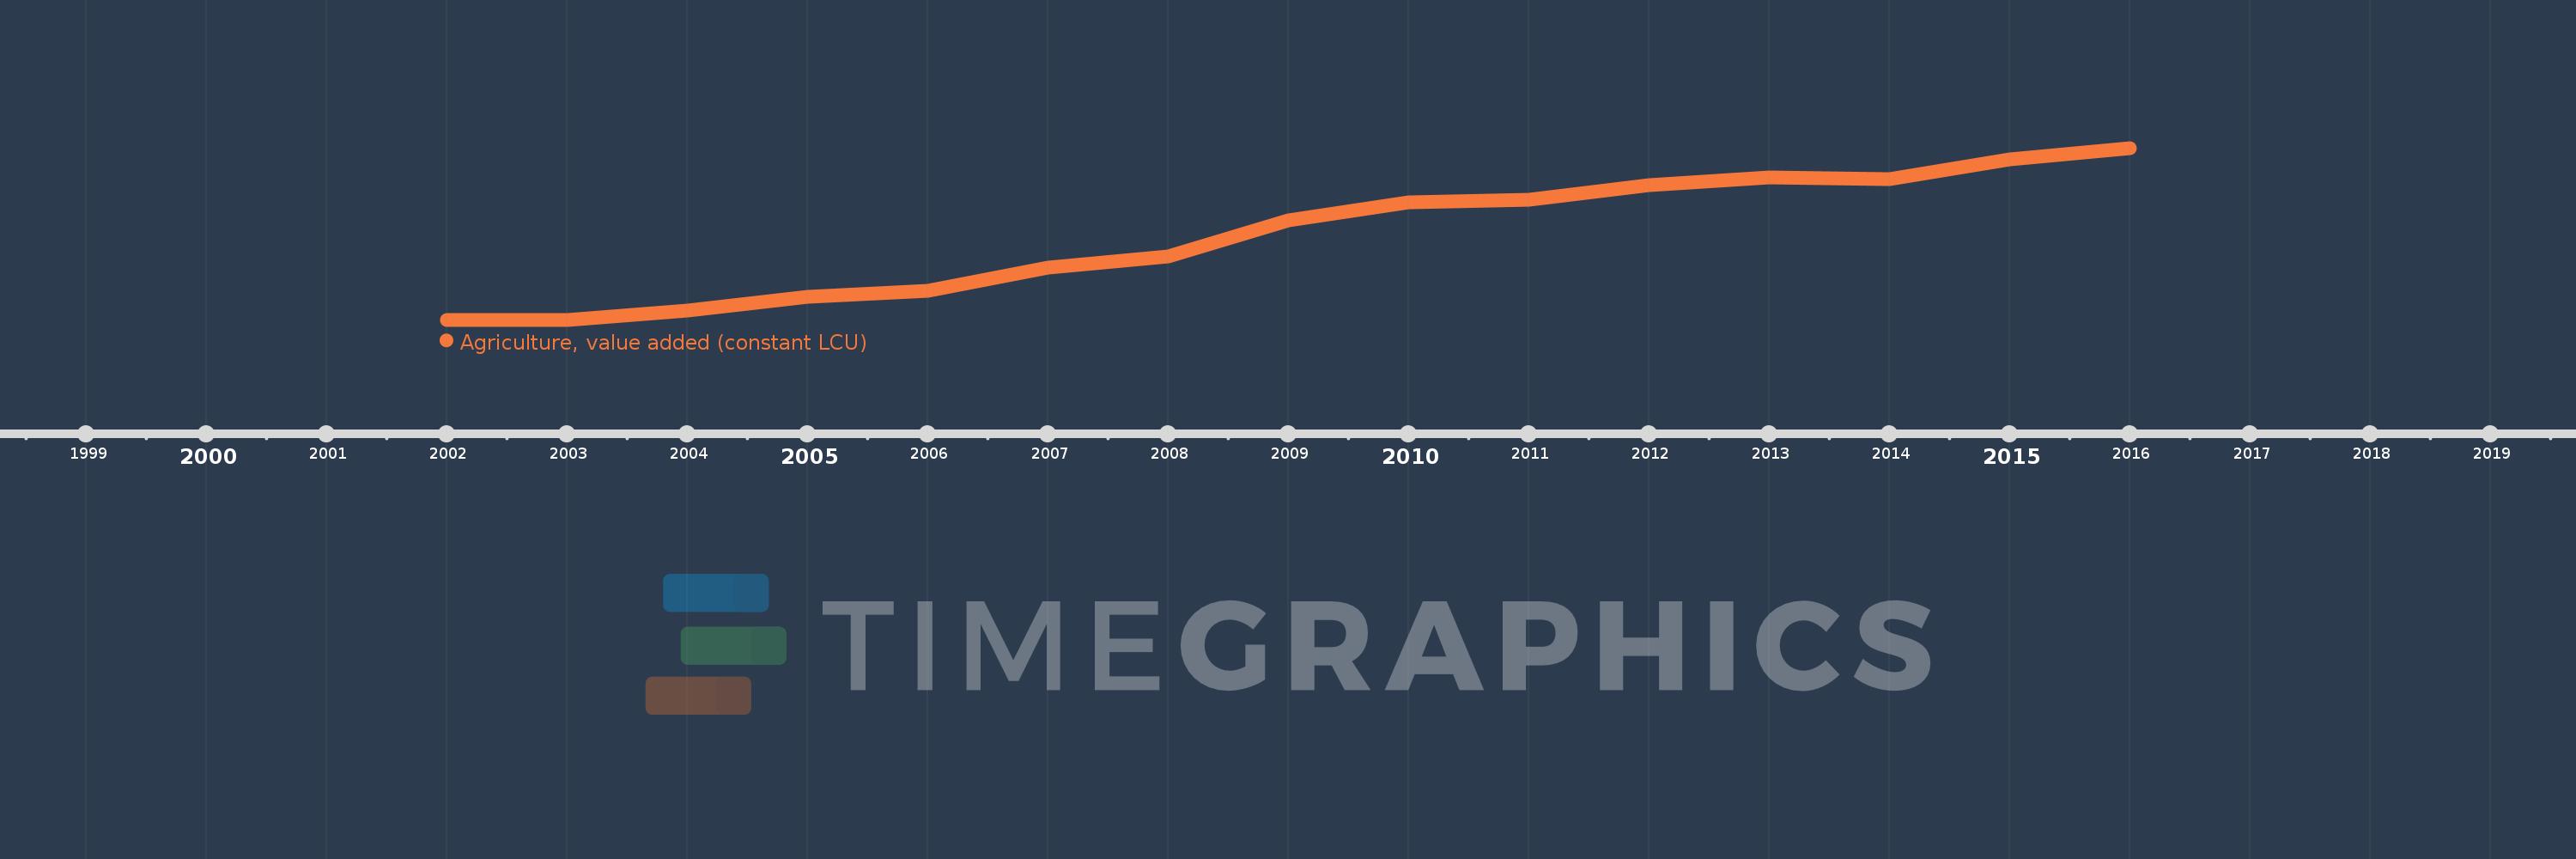
Agriculture, value added (constant LCU)
2016,2015,2014,2013,2012,2011,2010,2009,2008,2007,2006,2005,2004,2003,2002
This statistics in other country:
AfghanistanAlbaniaAlgeriaAntigua and BarbudaArgentinaArmeniaAustraliaAustriaAzerbaijanBahamas, TheBahrainBangladeshBelarusBelgiumBelizeBeninBermudaBhutanBoliviaBosnia and HerzegovinaBotswanaBrazilBrunei DarussalamBulgariaBurkina FasoBurundiCabo VerdeCambodiaCameroonCanadaCayman IslandsCentral African RepublicChadChileChinaColombiaComorosCongo, Dem. Rep.Congo, Rep.Costa RicaCote d'IvoireCroatiaCubaCyprusCzech RepublicDenmarkDjiboutiDominicaDominican RepublicEcuadorEgypt, Arab Rep.El SalvadorEquatorial GuineaEritreaEstoniaEthiopiaFijiFinlandFranceGabonGambia, TheGeorgiaGermanyGhanaGreeceGrenadaGuatemalaGuineaGuinea-BissauGuyanaHaitiHondurasHong Kong SAR, ChinaHungaryIcelandIndiaIndonesiaIran, Islamic Rep.IraqIrelandItalyJamaicaJapanJordanKazakhstanKenyaKiribatiKorea, Rep.KosovoKuwaitKyrgyz RepublicLao PDRLatviaLebanonLesothoLiberiaLithuaniaLuxembourgMacedonia, FYRMadagascarMalawiMalaysiaMaldivesMaliMarshall IslandsMauritaniaMauritiusMexicoMicronesia, Fed. Sts.MoldovaMongoliaMontenegroMoroccoMozambiqueMyanmarNamibiaNepalNetherlandsNew ZealandNicaraguaNigerNigeriaNorwayOmanPakistanPalauPanamaPapua New GuineaParaguayPeruPhilippinesPolandPortugalPuerto RicoQatarRomaniaRussian FederationRwandaSamoaSao Tome and PrincipeSaudi ArabiaSenegalSerbiaSeychellesSierra LeoneSingaporeSlovak RepublicSloveniaSolomon IslandsSomaliaSouth AfricaSpainSri LankaSt. Kitts and NevisSt. LuciaSt. Vincent and the GrenadinesSudanSurinameSwazilandSwedenSwitzerlandSyrian Arab RepublicTajikistanTanzaniaThailandTimor-LesteTogoTongaTrinidad and TobagoTunisiaTurkeyTurkmenistanTuvaluUgandaUkraineUnited Arab EmiratesUnited KingdomUnited StatesUruguayUzbekistanVanuatuVenezuela, RBVietnamWest Bank and GazaZambiaZimbabwe Timeline:
This timeline shows a graph from 2002 to 2016 of Sao Tome and Principe. No data until 2001. Number of actual observations by date: 15.
Source name:
World Development Indicators
Source organization:
World Bank national accounts data, and OECD National Accounts data files.
Categories, topics:
Economy & Growth
Last updated:
apr 23, 2017
Indicators value changes by year
Minimum:
205.253 bln
jan 1, 2002
Maximum:
302.89 bln
jan 1, 2016
At the date of observation
Value
Absolute change
Change from previous value
jan 1, 2002
205.253 bln
+205.253 bln
0.0%
jan 1, 2003
205.28 bln
+27.347 mln
0.01%
jan 1, 2004
210.373 bln
+5.093 bln
2.48%
jan 1, 2005
218.256 bln
+7.883 bln
3.75%
jan 1, 2006
221.717 bln
+3.461 bln
1.59%
jan 1, 2007
234.828 bln
+13.112 bln
5.91%
jan 1, 2008
241.145 bln
+6.317 bln
2.69%
jan 1, 2009
261.869 bln
+20.724 bln
8.59%
jan 1, 2010
271.769 bln
+9.9 bln
3.78%
jan 1, 2011
273.545 bln
+1.776 bln
0.65%
jan 1, 2012
281.747 bln
+8.202 bln
3.0%
jan 1, 2013
286.171 bln
+4.423 bln
1.57%
jan 1, 2014
285.055 bln
-1.116 bln
-0.39%
jan 1, 2015
296.478 bln
+11.424 bln
4.01%
jan 1, 2016
302.89 bln
+6.411 bln
2.16%
Ranking of countries by current statistics by years


Comments: