29
/
en
AIzaSyAYiBZKx7MnpbEhh9jyipgxe19OcubqV5w
April 1, 2024
281905
Vietnam
VNM
true
2
1
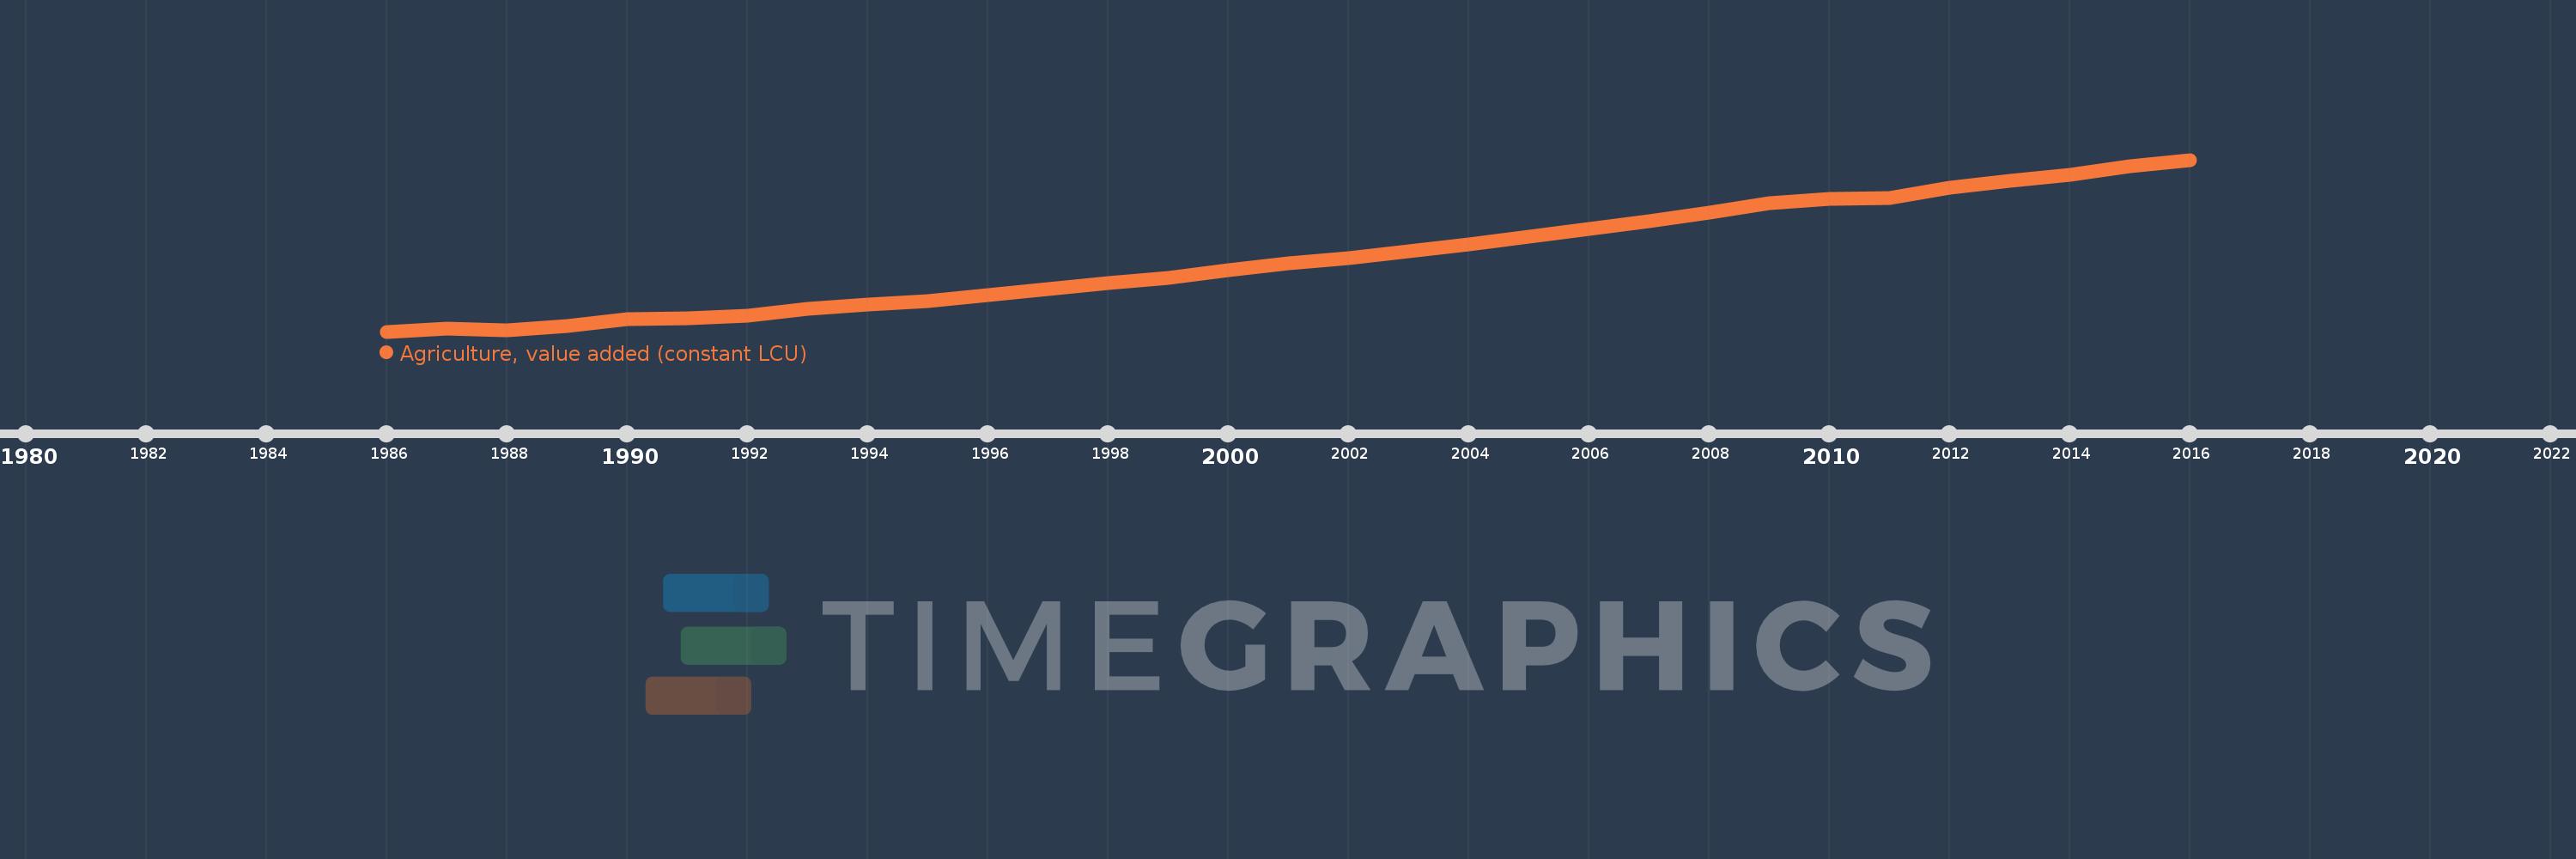
Agriculture, value added (constant LCU)
2016,2015,2014,2013,2012,2011,2010,2009,2008,2007,2006,2005,2004,2003,2002,2001,2000,1999,1998,1997,1996,1995,1994,1993,1992,1991,1990,1989,1988,1987,1986
This statistics in other country:
AfghanistanAlbaniaAlgeriaAntigua and BarbudaArgentinaArmeniaAustraliaAustriaAzerbaijanBahamas, TheBahrainBangladeshBelarusBelgiumBelizeBeninBermudaBhutanBoliviaBosnia and HerzegovinaBotswanaBrazilBrunei DarussalamBulgariaBurkina FasoBurundiCabo VerdeCambodiaCameroonCanadaCayman IslandsCentral African RepublicChadChileChinaColombiaComorosCongo, Dem. Rep.Congo, Rep.Costa RicaCote d'IvoireCroatiaCubaCyprusCzech RepublicDenmarkDjiboutiDominicaDominican RepublicEcuadorEgypt, Arab Rep.El SalvadorEquatorial GuineaEritreaEstoniaEthiopiaFijiFinlandFranceGabonGambia, TheGeorgiaGermanyGhanaGreeceGrenadaGuatemalaGuineaGuinea-BissauGuyanaHaitiHondurasHong Kong SAR, ChinaHungaryIcelandIndiaIndonesiaIran, Islamic Rep.IraqIrelandItalyJamaicaJapanJordanKazakhstanKenyaKiribatiKorea, Rep.KosovoKuwaitKyrgyz RepublicLao PDRLatviaLebanonLesothoLiberiaLithuaniaLuxembourgMacedonia, FYRMadagascarMalawiMalaysiaMaldivesMaliMarshall IslandsMauritaniaMauritiusMexicoMicronesia, Fed. Sts.MoldovaMongoliaMontenegroMoroccoMozambiqueMyanmarNamibiaNepalNetherlandsNew ZealandNicaraguaNigerNigeriaNorwayOmanPakistanPalauPanamaPapua New GuineaParaguayPeruPhilippinesPolandPortugalPuerto RicoQatarRomaniaRussian FederationRwandaSamoaSao Tome and PrincipeSaudi ArabiaSenegalSerbiaSeychellesSierra LeoneSingaporeSlovak RepublicSloveniaSolomon IslandsSomaliaSouth AfricaSpainSri LankaSt. Kitts and NevisSt. LuciaSt. Vincent and the GrenadinesSudanSurinameSwazilandSwedenSwitzerlandSyrian Arab RepublicTajikistanTanzaniaThailandTimor-LesteTogoTongaTrinidad and TobagoTunisiaTurkeyTurkmenistanTuvaluUgandaUkraineUnited Arab EmiratesUnited KingdomUnited StatesUruguayUzbekistanVanuatuVenezuela, RBVietnamWest Bank and GazaZambiaZimbabwe Timeline:
This timeline shows a graph from 1986 to 2016 of Vietnam. No data until 1985. Number of actual observations by date: 31.
Source name:
World Development Indicators
Source organization:
World Bank national accounts data, and OECD National Accounts data files.
Categories, topics:
Economy & Growth
Last updated:
apr 23, 2017
Indicators value changes by year
Minimum:
163.325 trl
jan 1, 1986
Maximum:
462.536 trl
jan 1, 2016
At the date of observation
Value
Absolute change
Change from previous value
jan 1, 1986
163.325 trl
+163.325 trl
0.0%
jan 1, 1987
168.202 trl
+4.878 trl
2.99%
jan 1, 1988
166.282 trl
-1.92 trl
-1.14%
jan 1, 1989
172.348 trl
+6.066 trl
3.65%
jan 1, 1990
184.419 trl
+12.07 trl
7.0%
jan 1, 1991
186.254 trl
+1.836 trl
1.0%
jan 1, 1992
190.307 trl
+4.053 trl
2.18%
jan 1, 1993
203.397 trl
+13.09 trl
6.88%
jan 1, 1994
210.067 trl
+6.669 trl
3.28%
jan 1, 1995
217.139 trl
+7.073 trl
3.37%
jan 1, 1996
227.564 trl
+10.425 trl
4.8%
jan 1, 1997
237.577 trl
+10.013 trl
4.4%
jan 1, 1998
247.703 trl
+10.125 trl
4.26%
jan 1, 1999
256.596 trl
+8.893 trl
3.59%
jan 1, 2000
270.027 trl
+13.432 trl
5.23%
jan 1, 2001
282.541 trl
+12.514 trl
4.63%
jan 1, 2002
291.502 trl
+8.961 trl
3.17%
jan 1, 2003
303.707 trl
+12.205 trl
4.19%
jan 1, 2004
314.985 trl
+11.278 trl
3.71%
jan 1, 2005
329.027 trl
+14.042 trl
4.46%
jan 1, 2006
342.811 trl
+13.784 trl
4.19%
jan 1, 2007
355.831 trl
+13.02 trl
3.8%
jan 1, 2008
369.905 trl
+14.074 trl
3.96%
jan 1, 2009
387.262 trl
+17.357 trl
4.69%
jan 1, 2010
394.658 trl
+7.396 trl
1.91%
jan 1, 2011
396.576 trl
+1.918 trl
0.49%
jan 1, 2012
413.368 trl
+16.792 trl
4.23%
jan 1, 2013
425.446 trl
+12.078 trl
2.92%
jan 1, 2014
436.642 trl
+11.196 trl
2.63%
jan 1, 2015
451.659 trl
+15.017 trl
3.44%
jan 1, 2016
462.536 trl
+10.877 trl
2.41%
Ranking of countries by current statistics by years


Comments: