29
/
en
AIzaSyAYiBZKx7MnpbEhh9jyipgxe19OcubqV5w
April 1, 2024
117620
Czech Republic
CZE
true
2
1
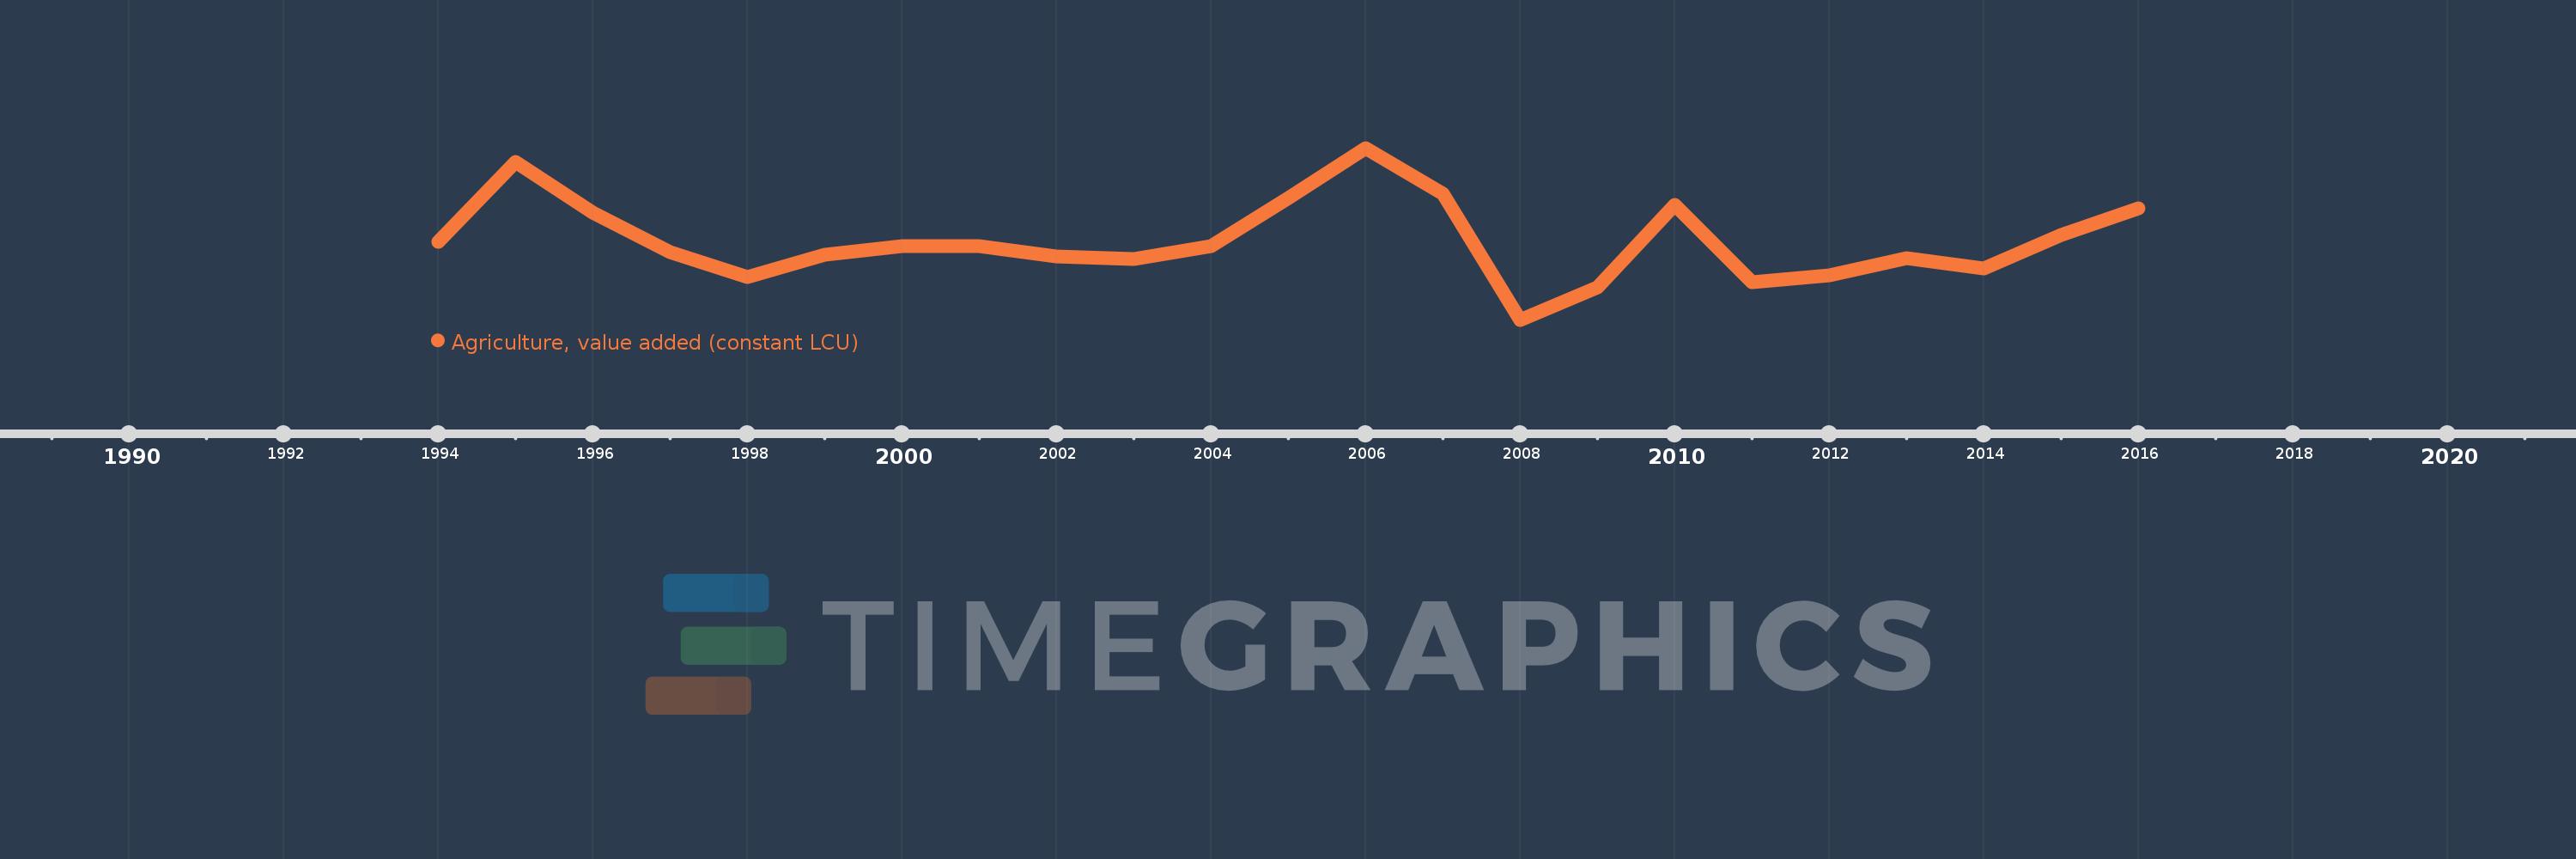
Agriculture, value added (constant LCU)
2016,2015,2014,2013,2012,2011,2010,2009,2008,2007,2006,2005,2004,2003,2002,2001,2000,1999,1998,1997,1996,1995,1994
This statistics in other country:
AfghanistanAlbaniaAlgeriaAntigua and BarbudaArgentinaArmeniaAustraliaAustriaAzerbaijanBahamas, TheBahrainBangladeshBelarusBelgiumBelizeBeninBermudaBhutanBoliviaBosnia and HerzegovinaBotswanaBrazilBrunei DarussalamBulgariaBurkina FasoBurundiCabo VerdeCambodiaCameroonCanadaCayman IslandsCentral African RepublicChadChileChinaColombiaComorosCongo, Dem. Rep.Congo, Rep.Costa RicaCote d'IvoireCroatiaCubaCyprusCzech RepublicDenmarkDjiboutiDominicaDominican RepublicEcuadorEgypt, Arab Rep.El SalvadorEquatorial GuineaEritreaEstoniaEthiopiaFijiFinlandFranceGabonGambia, TheGeorgiaGermanyGhanaGreeceGrenadaGuatemalaGuineaGuinea-BissauGuyanaHaitiHondurasHong Kong SAR, ChinaHungaryIcelandIndiaIndonesiaIran, Islamic Rep.IraqIrelandItalyJamaicaJapanJordanKazakhstanKenyaKiribatiKorea, Rep.KosovoKuwaitKyrgyz RepublicLao PDRLatviaLebanonLesothoLiberiaLithuaniaLuxembourgMacedonia, FYRMadagascarMalawiMalaysiaMaldivesMaliMarshall IslandsMauritaniaMauritiusMexicoMicronesia, Fed. Sts.MoldovaMongoliaMontenegroMoroccoMozambiqueMyanmarNamibiaNepalNetherlandsNew ZealandNicaraguaNigerNigeriaNorwayOmanPakistanPalauPanamaPapua New GuineaParaguayPeruPhilippinesPolandPortugalPuerto RicoQatarRomaniaRussian FederationRwandaSamoaSao Tome and PrincipeSaudi ArabiaSenegalSerbiaSeychellesSierra LeoneSingaporeSlovak RepublicSloveniaSolomon IslandsSomaliaSouth AfricaSpainSri LankaSt. Kitts and NevisSt. LuciaSt. Vincent and the GrenadinesSudanSurinameSwazilandSwedenSwitzerlandSyrian Arab RepublicTajikistanTanzaniaThailandTimor-LesteTogoTongaTrinidad and TobagoTunisiaTurkeyTurkmenistanTuvaluUgandaUkraineUnited Arab EmiratesUnited KingdomUnited StatesUruguayUzbekistanVanuatuVenezuela, RBVietnamWest Bank and GazaZambiaZimbabwe Timeline:
This timeline shows a graph from 1994 to 2016 of Czech Republic. No data until 1993. Number of actual observations by date: 23.
Source name:
World Development Indicators
Source organization:
World Bank national accounts data, and OECD National Accounts data files.
Categories, topics:
Economy & Growth
Last updated:
apr 23, 2017
Indicators value changes by year
Minimum:
54.657 bln
jan 1, 2008
Maximum:
80.391 bln
jan 1, 2006
At the date of observation
Value
Absolute change
Change from previous value
jan 1, 1994
66.292 bln
+66.292 bln
0.0%
jan 1, 1995
78.327 bln
+12.035 bln
18.15%
jan 1, 1996
70.756 bln
-7.571 bln
-9.67%
jan 1, 1997
64.83 bln
-5.926 bln
-8.38%
jan 1, 1998
61.001 bln
-3.829 bln
-5.91%
jan 1, 1999
64.374 bln
+3.373 bln
5.53%
jan 1, 2000
65.632 bln
+1.258 bln
1.95%
jan 1, 2001
65.65 bln
+18.0 mln
0.03%
jan 1, 2002
64.153 bln
-1.497 bln
-2.28%
jan 1, 2003
63.728 bln
-425.0 mln
-0.66%
jan 1, 2004
65.626 bln
+1.898 bln
2.98%
jan 1, 2005
72.87 bln
+7.244 bln
11.04%
jan 1, 2006
80.391 bln
+7.521 bln
10.32%
jan 1, 2007
73.486 bln
-6.905 bln
-8.59%
jan 1, 2008
54.657 bln
-18.829 bln
-25.62%
jan 1, 2009
59.555 bln
+4.898 bln
8.96%
jan 1, 2010
71.916 bln
+12.361 bln
20.76%
jan 1, 2011
60.217 bln
-11.699 bln
-16.27%
jan 1, 2012
61.372 bln
+1.155 bln
1.92%
jan 1, 2013
63.9 bln
+2.528 bln
4.12%
jan 1, 2014
62.339 bln
-1.561 bln
-2.44%
jan 1, 2015
67.368 bln
+5.029 bln
8.07%
jan 1, 2016
71.368 bln
+4.0 bln
5.94%
Ranking of countries by current statistics by years


Comments: