29
/
en
AIzaSyAYiBZKx7MnpbEhh9jyipgxe19OcubqV5w
April 1, 2024
226590
Puerto Rico
PRI
true
2
1
Agriculture, value added (constant LCU)
2014,2013,2012,2011,2010,2009,2008,2007,2006,2005,2004,2003,2002,2001,2000,1999,1998,1997,1996,1995,1994,1993,1992,1991,1990,1989,1988,1987,1986,1985,1984,1983,1982,1981,1980,1979,1978,1977,1976,1975,1974,1973,1972
This statistics in other country:
AfghanistanAlbaniaAlgeriaAntigua and BarbudaArgentinaArmeniaAustraliaAustriaAzerbaijanBahamas, TheBahrainBangladeshBelarusBelgiumBelizeBeninBermudaBhutanBoliviaBosnia and HerzegovinaBotswanaBrazilBrunei DarussalamBulgariaBurkina FasoBurundiCabo VerdeCambodiaCameroonCanadaCayman IslandsCentral African RepublicChadChileChinaColombiaComorosCongo, Dem. Rep.Congo, Rep.Costa RicaCote d'IvoireCroatiaCubaCyprusCzech RepublicDenmarkDjiboutiDominicaDominican RepublicEcuadorEgypt, Arab Rep.El SalvadorEquatorial GuineaEritreaEstoniaEthiopiaFijiFinlandFranceGabonGambia, TheGeorgiaGermanyGhanaGreeceGrenadaGuatemalaGuineaGuinea-BissauGuyanaHaitiHondurasHong Kong SAR, ChinaHungaryIcelandIndiaIndonesiaIran, Islamic Rep.IraqIrelandItalyJamaicaJapanJordanKazakhstanKenyaKiribatiKorea, Rep.KosovoKuwaitKyrgyz RepublicLao PDRLatviaLebanonLesothoLiberiaLithuaniaLuxembourgMacedonia, FYRMadagascarMalawiMalaysiaMaldivesMaliMarshall IslandsMauritaniaMauritiusMexicoMicronesia, Fed. Sts.MoldovaMongoliaMontenegroMoroccoMozambiqueMyanmarNamibiaNepalNetherlandsNew ZealandNicaraguaNigerNigeriaNorwayOmanPakistanPalauPanamaPapua New GuineaParaguayPeruPhilippinesPolandPortugalPuerto RicoQatarRomaniaRussian FederationRwandaSamoaSao Tome and PrincipeSaudi ArabiaSenegalSerbiaSeychellesSierra LeoneSingaporeSlovak RepublicSloveniaSolomon IslandsSomaliaSouth AfricaSpainSri LankaSt. Kitts and NevisSt. LuciaSt. Vincent and the GrenadinesSudanSurinameSwazilandSwedenSwitzerlandSyrian Arab RepublicTajikistanTanzaniaThailandTimor-LesteTogoTongaTrinidad and TobagoTunisiaTurkeyTurkmenistanTuvaluUgandaUkraineUnited Arab EmiratesUnited KingdomUnited StatesUruguayUzbekistanVanuatuVenezuela, RBVietnamWest Bank and GazaZambiaZimbabwe Timeline:
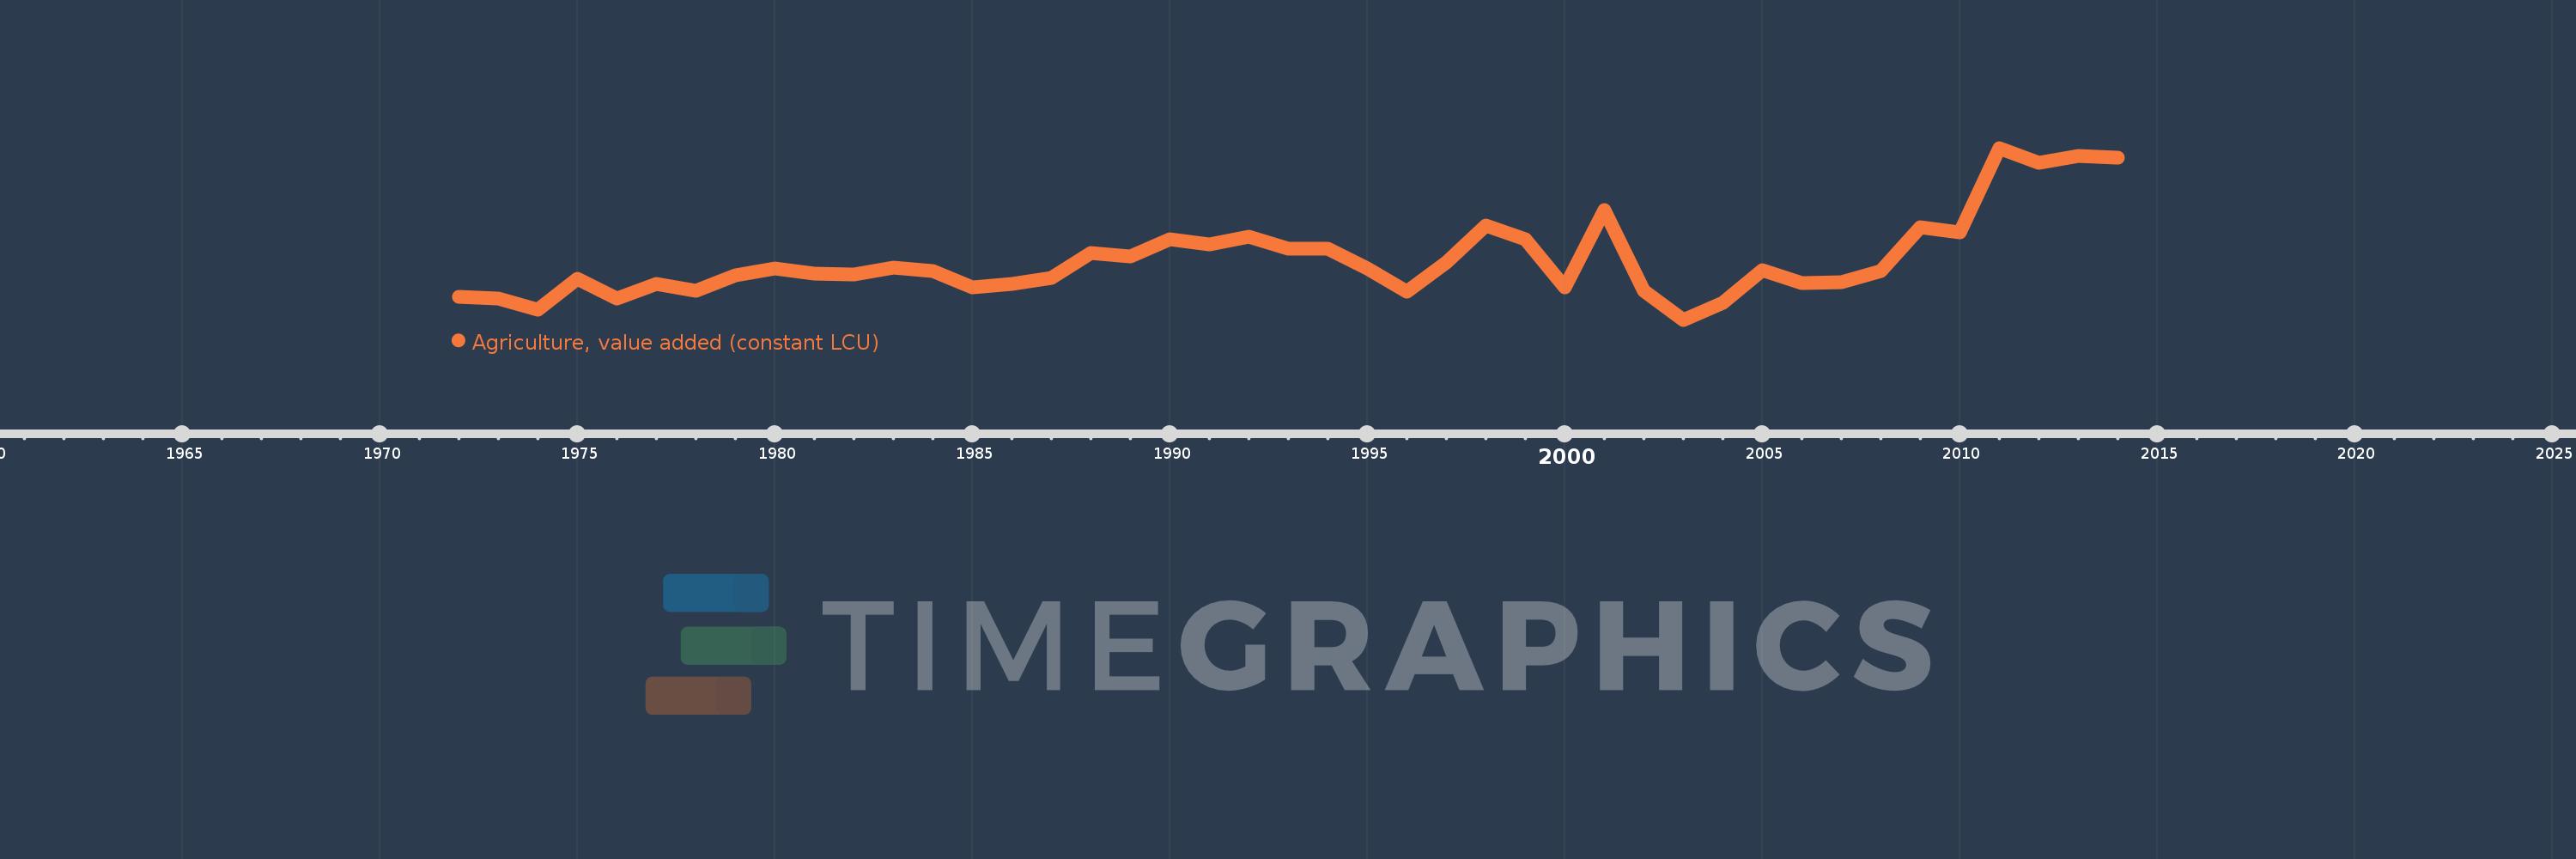
This timeline shows a graph from 1972 to 2014 of Puerto Rico. No data until 1971. Number of actual observations by date: 43.
Source name:
World Development Indicators
Source organization:
World Bank national accounts data, and OECD National Accounts data files.
Categories, topics:
Economy & Growth
Last updated:
apr 23, 2017
Indicators value changes by year
Minimum:
113.385 mln
jan 1, 2003
Maximum:
278.64 mln
jan 1, 2011
At the date of observation
Value
Absolute change
Change from previous value
jan 1, 1972
135.3 mln
+135.3 mln
0.0%
jan 1, 1973
133.394 mln
-1.906 mln
-1.41%
jan 1, 1974
122.913 mln
-10.481 mln
-7.86%
jan 1, 1975
152.451 mln
+29.537 mln
24.03%
jan 1, 1976
133.394 mln
-19.056 mln
-12.5%
jan 1, 1977
147.687 mln
+14.292 mln
10.71%
jan 1, 1978
141.017 mln
-6.67 mln
-4.52%
jan 1, 1979
156.262 mln
+15.245 mln
10.81%
jan 1, 1980
162.932 mln
+6.67 mln
4.27%
jan 1, 1981
158.168 mln
-4.764 mln
-2.92%
jan 1, 1982
157.215 mln
-952.817K
-0.6%
jan 1, 1983
163.885 mln
+6.67 mln
4.24%
jan 1, 1984
160.073 mln
-3.811 mln
-2.33%
jan 1, 1985
144.828 mln
-15.245 mln
-9.52%
jan 1, 1986
147.687 mln
+2.858 mln
1.97%
jan 1, 1987
153.404 mln
+5.717 mln
3.87%
jan 1, 1988
177.224 mln
+23.82 mln
15.53%
jan 1, 1989
174.365 mln
-2.858 mln
-1.61%
jan 1, 1990
190.563 mln
+16.198 mln
9.29%
jan 1, 1991
185.799 mln
-4.764 mln
-2.5%
jan 1, 1992
193.422 mln
+7.623 mln
4.1%
jan 1, 1993
181.988 mln
-11.434 mln
-5.91%
jan 1, 1994
181.988 mln
0.0
0.0%
jan 1, 1995
162.932 mln
-19.056 mln
-10.47%
jan 1, 1996
140.064 mln
-22.868 mln
-14.04%
jan 1, 1997
168.649 mln
+28.585 mln
20.41%
jan 1, 1998
203.903 mln
+35.254 mln
20.9%
jan 1, 1999
190.563 mln
-13.339 mln
-6.54%
jan 1, 2000
144.828 mln
-45.735 mln
-24.0%
jan 1, 2001
219.148 mln
+74.32 mln
51.32%
jan 1, 2002
141.017 mln
-78.131 mln
-35.65%
jan 1, 2003
113.385 mln
-27.632 mln
-19.59%
jan 1, 2004
129.583 mln
+16.198 mln
14.29%
jan 1, 2005
161.026 mln
+31.443 mln
24.26%
jan 1, 2006
148.639 mln
-12.387 mln
-7.69%
jan 1, 2007
149.592 mln
+952.817K
0.64%
jan 1, 2008
160.073 mln
+10.481 mln
7.01%
jan 1, 2009
202.568 mln
+42.495 mln
26.55%
jan 1, 2010
197.029 mln
-5.539 mln
-2.73%
jan 1, 2011
278.64 mln
+81.611 mln
41.42%
jan 1, 2012
264.12 mln
-14.521 mln
-5.21%
jan 1, 2013
270.626 mln
+6.506 mln
2.46%
jan 1, 2014
269.67 mln
-955.499K
-0.35%
Ranking of countries by current statistics by years


Comments: