29
/
en
AIzaSyAYiBZKx7MnpbEhh9jyipgxe19OcubqV5w
April 1, 2024
130087
Ethiopia
ETH
true
2
1
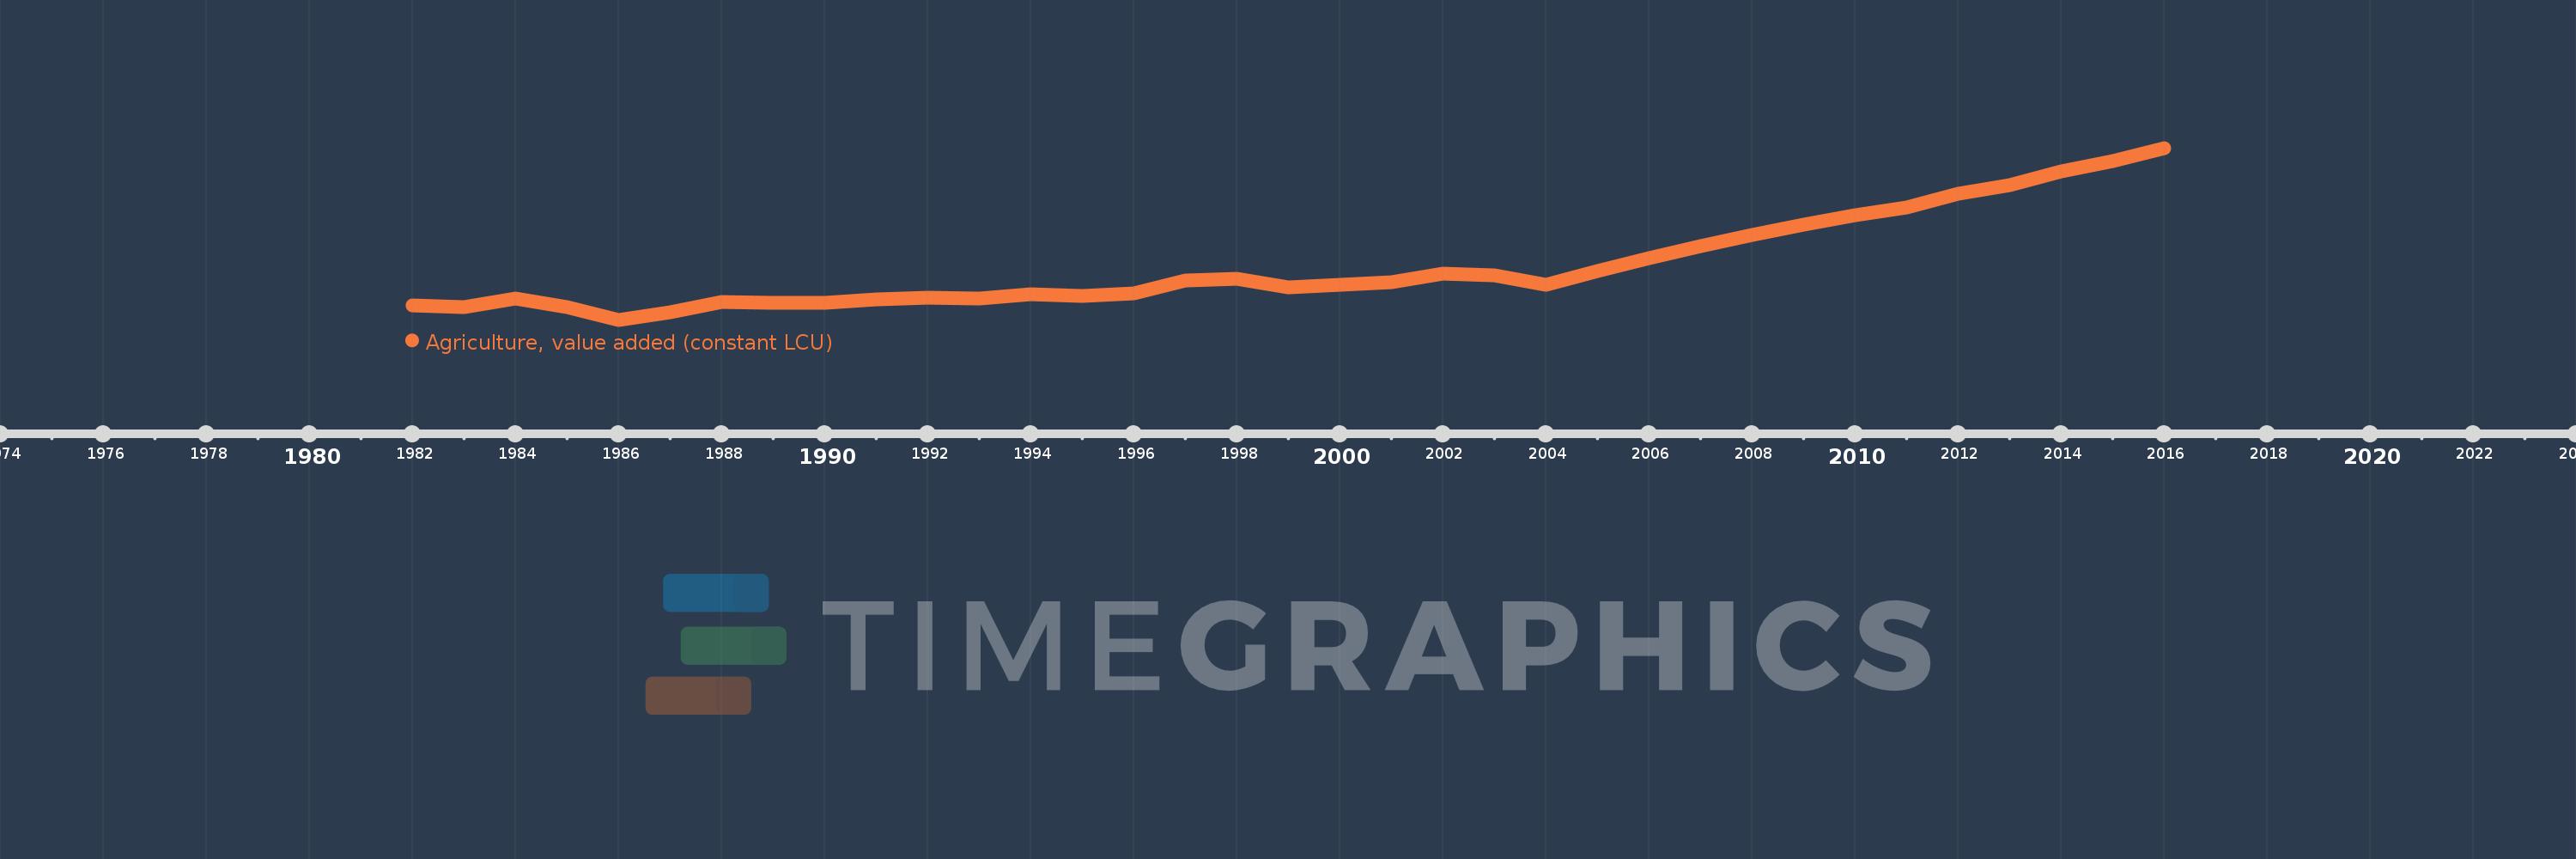
Agriculture, value added (constant LCU)
2016,2015,2014,2013,2012,2011,2010,2009,2008,2007,2006,2005,2004,2003,2002,2001,2000,1999,1998,1997,1996,1995,1994,1993,1992,1991,1990,1989,1988,1987,1986,1985,1984,1983,1982
This statistics in other country:
AfghanistanAlbaniaAlgeriaAntigua and BarbudaArgentinaArmeniaAustraliaAustriaAzerbaijanBahamas, TheBahrainBangladeshBelarusBelgiumBelizeBeninBermudaBhutanBoliviaBosnia and HerzegovinaBotswanaBrazilBrunei DarussalamBulgariaBurkina FasoBurundiCabo VerdeCambodiaCameroonCanadaCayman IslandsCentral African RepublicChadChileChinaColombiaComorosCongo, Dem. Rep.Congo, Rep.Costa RicaCote d'IvoireCroatiaCubaCyprusCzech RepublicDenmarkDjiboutiDominicaDominican RepublicEcuadorEgypt, Arab Rep.El SalvadorEquatorial GuineaEritreaEstoniaEthiopiaFijiFinlandFranceGabonGambia, TheGeorgiaGermanyGhanaGreeceGrenadaGuatemalaGuineaGuinea-BissauGuyanaHaitiHondurasHong Kong SAR, ChinaHungaryIcelandIndiaIndonesiaIran, Islamic Rep.IraqIrelandItalyJamaicaJapanJordanKazakhstanKenyaKiribatiKorea, Rep.KosovoKuwaitKyrgyz RepublicLao PDRLatviaLebanonLesothoLiberiaLithuaniaLuxembourgMacedonia, FYRMadagascarMalawiMalaysiaMaldivesMaliMarshall IslandsMauritaniaMauritiusMexicoMicronesia, Fed. Sts.MoldovaMongoliaMontenegroMoroccoMozambiqueMyanmarNamibiaNepalNetherlandsNew ZealandNicaraguaNigerNigeriaNorwayOmanPakistanPalauPanamaPapua New GuineaParaguayPeruPhilippinesPolandPortugalPuerto RicoQatarRomaniaRussian FederationRwandaSamoaSao Tome and PrincipeSaudi ArabiaSenegalSerbiaSeychellesSierra LeoneSingaporeSlovak RepublicSloveniaSolomon IslandsSomaliaSouth AfricaSpainSri LankaSt. Kitts and NevisSt. LuciaSt. Vincent and the GrenadinesSudanSurinameSwazilandSwedenSwitzerlandSyrian Arab RepublicTajikistanTanzaniaThailandTimor-LesteTogoTongaTrinidad and TobagoTunisiaTurkeyTurkmenistanTuvaluUgandaUkraineUnited Arab EmiratesUnited KingdomUnited StatesUruguayUzbekistanVanuatuVenezuela, RBVietnamWest Bank and GazaZambiaZimbabwe Timeline:
This timeline shows a graph from 1982 to 2016 of Ethiopia. No data until 1981. Number of actual observations by date: 35.
Source name:
World Development Indicators
Source organization:
World Bank national accounts data, and OECD National Accounts data files.
Categories, topics:
Economy & Growth
Last updated:
apr 23, 2017
Indicators value changes by year
Minimum:
58.338 bln
jan 1, 1986
Maximum:
267.856 bln
jan 1, 2016
At the date of observation
Value
Absolute change
Change from previous value
jan 1, 1982
75.845 bln
+75.845 bln
0.0%
jan 1, 1983
73.463 bln
-2.382 bln
-3.14%
jan 1, 1984
83.789 bln
+10.325 bln
14.05%
jan 1, 1985
73.407 bln
-10.381 bln
-12.39%
jan 1, 1986
58.338 bln
-15.069 bln
-20.53%
jan 1, 1987
67.975 bln
+9.637 bln
16.52%
jan 1, 1988
79.79 bln
+11.815 bln
17.38%
jan 1, 1989
78.639 bln
-1.151 bln
-1.44%
jan 1, 1990
79.375 bln
+736.317 mln
0.94%
jan 1, 1991
83.681 bln
+4.306 bln
5.43%
jan 1, 1992
85.75 bln
+2.069 bln
2.47%
jan 1, 1993
84.407 bln
-1.343 bln
-1.57%
jan 1, 1994
89.967 bln
+5.56 bln
6.59%
jan 1, 1995
87.646 bln
-2.321 bln
-2.58%
jan 1, 1996
90.947 bln
+3.301 bln
3.77%
jan 1, 1997
106.373 bln
+15.426 bln
16.96%
jan 1, 1998
108.503 bln
+2.13 bln
2.0%
jan 1, 1999
98.043 bln
-10.46 bln
-9.64%
jan 1, 2000
101.374 bln
+3.331 bln
3.4%
jan 1, 2001
104.47 bln
+3.095 bln
3.05%
jan 1, 2002
114.524 bln
+10.054 bln
9.62%
jan 1, 2003
112.376 bln
-2.148 bln
-1.88%
jan 1, 2004
100.594 bln
-11.782 bln
-10.48%
jan 1, 2005
117.639 bln
+17.045 bln
16.94%
jan 1, 2006
133.571 bln
+15.932 bln
13.54%
jan 1, 2007
148.142 bln
+14.571 bln
10.91%
jan 1, 2008
162.139 bln
+13.997 bln
9.45%
jan 1, 2009
174.301 bln
+12.163 bln
7.5%
jan 1, 2010
185.389 bln
+11.087 bln
6.36%
jan 1, 2011
194.9 bln
+9.511 bln
5.13%
jan 1, 2012
212.47 bln
+17.57 bln
9.01%
jan 1, 2013
222.928 bln
+10.458 bln
4.92%
jan 1, 2014
238.752 bln
+15.824 bln
7.1%
jan 1, 2015
251.756 bln
+13.004 bln
5.45%
jan 1, 2016
267.856 bln
+16.099 bln
6.39%
Ranking of countries by current statistics by years


Comments: