29
/
en
AIzaSyAYiBZKx7MnpbEhh9jyipgxe19OcubqV5w
April 1, 2024
198734
Mongolia
MNG
true
2
1
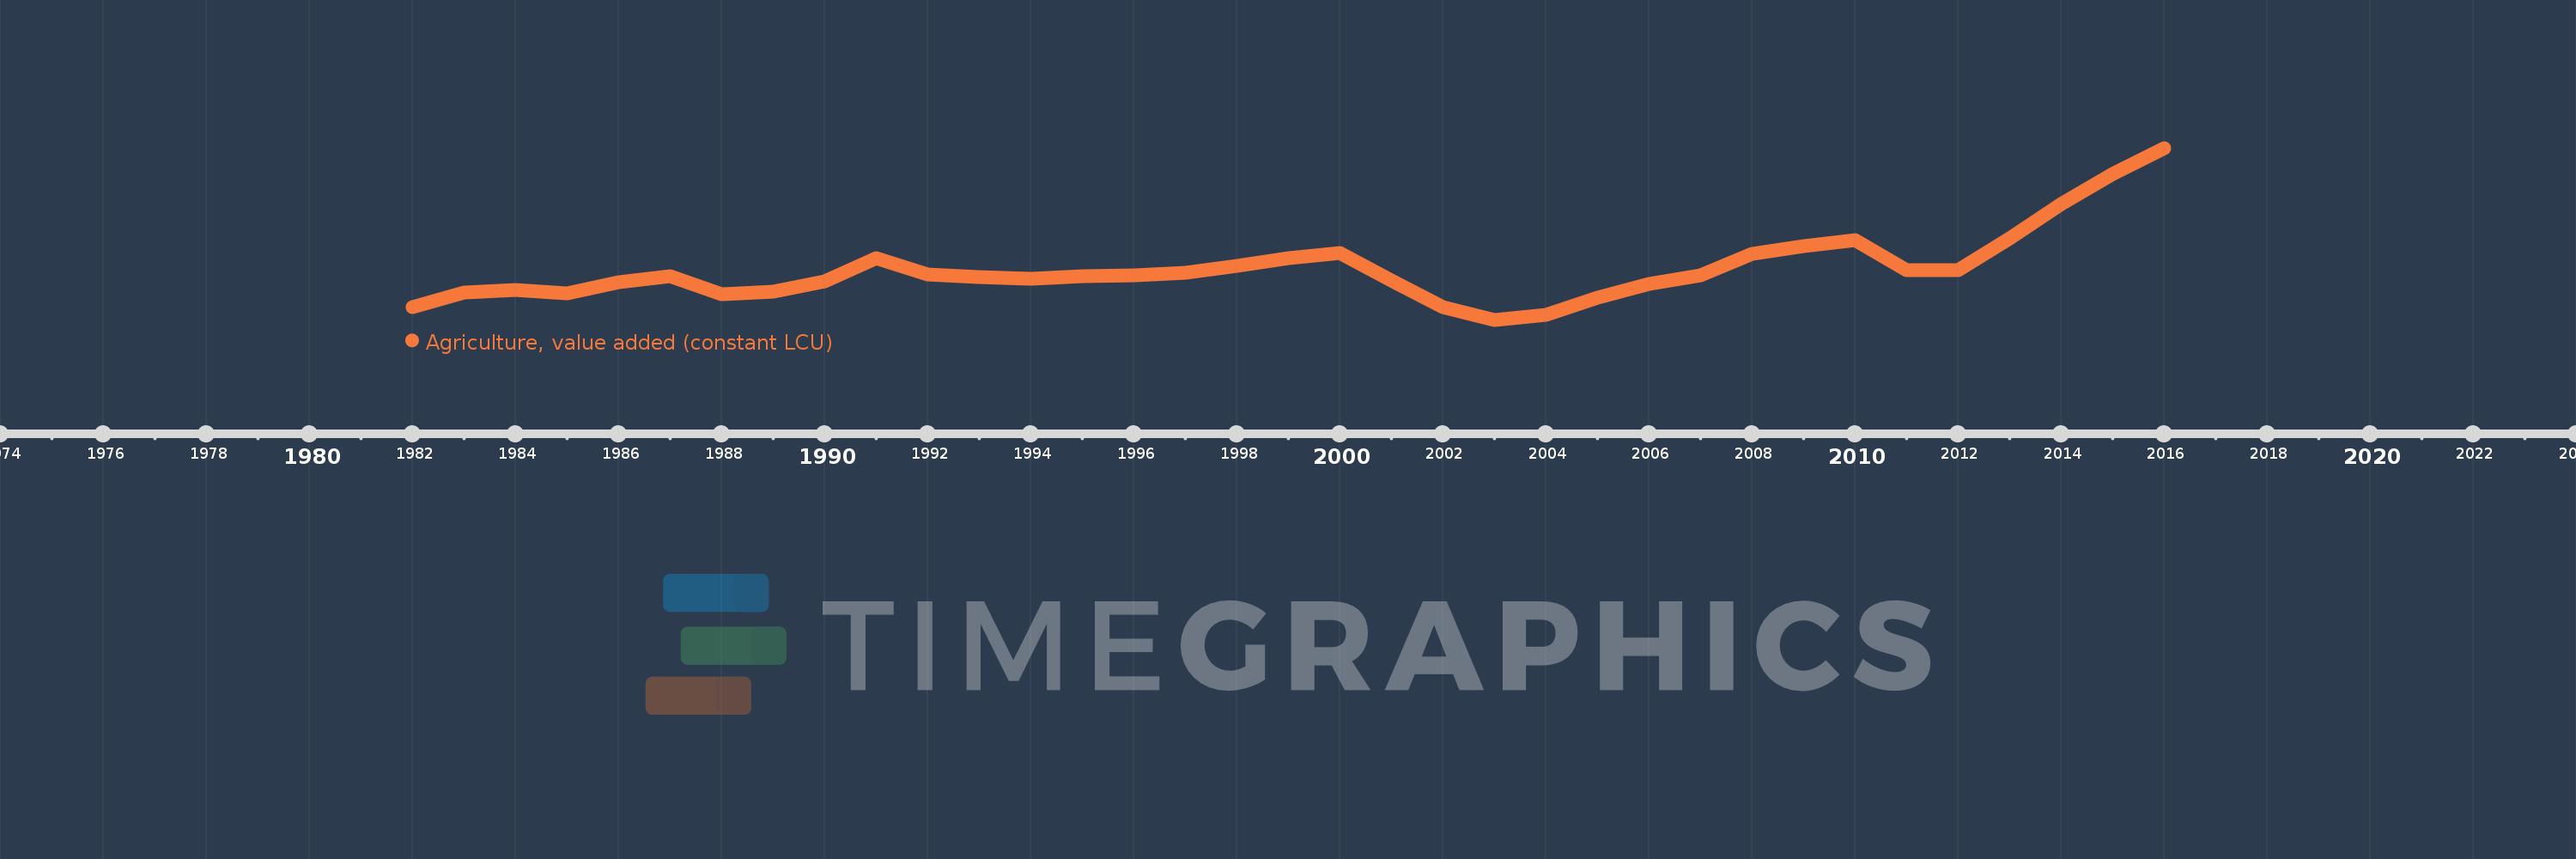
Agriculture, value added (constant LCU)
2016,2015,2014,2013,2012,2011,2010,2009,2008,2007,2006,2005,2004,2003,2002,2001,2000,1999,1998,1997,1996,1995,1994,1993,1992,1991,1990,1989,1988,1987,1986,1985,1984,1983,1982
This statistics in other country:
AfghanistanAlbaniaAlgeriaAntigua and BarbudaArgentinaArmeniaAustraliaAustriaAzerbaijanBahamas, TheBahrainBangladeshBelarusBelgiumBelizeBeninBermudaBhutanBoliviaBosnia and HerzegovinaBotswanaBrazilBrunei DarussalamBulgariaBurkina FasoBurundiCabo VerdeCambodiaCameroonCanadaCayman IslandsCentral African RepublicChadChileChinaColombiaComorosCongo, Dem. Rep.Congo, Rep.Costa RicaCote d'IvoireCroatiaCubaCyprusCzech RepublicDenmarkDjiboutiDominicaDominican RepublicEcuadorEgypt, Arab Rep.El SalvadorEquatorial GuineaEritreaEstoniaEthiopiaFijiFinlandFranceGabonGambia, TheGeorgiaGermanyGhanaGreeceGrenadaGuatemalaGuineaGuinea-BissauGuyanaHaitiHondurasHong Kong SAR, ChinaHungaryIcelandIndiaIndonesiaIran, Islamic Rep.IraqIrelandItalyJamaicaJapanJordanKazakhstanKenyaKiribatiKorea, Rep.KosovoKuwaitKyrgyz RepublicLao PDRLatviaLebanonLesothoLiberiaLithuaniaLuxembourgMacedonia, FYRMadagascarMalawiMalaysiaMaldivesMaliMarshall IslandsMauritaniaMauritiusMexicoMicronesia, Fed. Sts.MoldovaMongoliaMontenegroMoroccoMozambiqueMyanmarNamibiaNepalNetherlandsNew ZealandNicaraguaNigerNigeriaNorwayOmanPakistanPalauPanamaPapua New GuineaParaguayPeruPhilippinesPolandPortugalPuerto RicoQatarRomaniaRussian FederationRwandaSamoaSao Tome and PrincipeSaudi ArabiaSenegalSerbiaSeychellesSierra LeoneSingaporeSlovak RepublicSloveniaSolomon IslandsSomaliaSouth AfricaSpainSri LankaSt. Kitts and NevisSt. LuciaSt. Vincent and the GrenadinesSudanSurinameSwazilandSwedenSwitzerlandSyrian Arab RepublicTajikistanTanzaniaThailandTimor-LesteTogoTongaTrinidad and TobagoTunisiaTurkeyTurkmenistanTuvaluUgandaUkraineUnited Arab EmiratesUnited KingdomUnited StatesUruguayUzbekistanVanuatuVenezuela, RBVietnamWest Bank and GazaZambiaZimbabwe Timeline:
This timeline shows a graph from 1982 to 2016 of Mongolia. No data until 1981. Number of actual observations by date: 35.
Source name:
World Development Indicators
Source organization:
World Bank national accounts data, and OECD National Accounts data files.
Categories, topics:
Economy & Growth
Last updated:
apr 23, 2017
Indicators value changes by year
Minimum:
765.794 bln
jan 1, 2003
Maximum:
2.072 trl
jan 1, 2016
At the date of observation
Value
Absolute change
Change from previous value
jan 1, 1982
861.717 bln
+861.717 bln
0.0%
jan 1, 1983
971.601 bln
+109.883 bln
12.75%
jan 1, 1984
992.565 bln
+20.965 bln
2.16%
jan 1, 1985
966.54 bln
-26.025 bln
-2.62%
jan 1, 1986
1.052 trl
+85.304 bln
8.83%
jan 1, 1987
1.1 trl
+47.712 bln
4.54%
jan 1, 1988
957.865 bln
-141.692 bln
-12.89%
jan 1, 1989
980.276 bln
+22.41 bln
2.34%
jan 1, 1990
1.056 trl
+75.481 bln
7.7%
jan 1, 1991
1.235 trl
+179.002 bln
16.95%
jan 1, 1992
1.113 trl
-121.967 bln
-9.88%
jan 1, 1993
1.089 trl
-23.848 bln
-2.14%
jan 1, 1994
1.08 trl
-9.04 bln
-0.83%
jan 1, 1995
1.1 trl
+20.006 bln
1.85%
jan 1, 1996
1.103 trl
+2.643 bln
0.24%
jan 1, 1997
1.126 trl
+23.275 bln
2.11%
jan 1, 1998
1.176 trl
+49.933 bln
4.44%
jan 1, 1999
1.236 trl
+60.679 bln
5.16%
jan 1, 2000
1.272 trl
+35.398 bln
2.86%
jan 1, 2001
1.064 trl
-207.687 bln
-16.33%
jan 1, 2002
860.364 bln
-203.788 bln
-19.15%
jan 1, 2003
765.794 bln
-94.569 bln
-10.99%
jan 1, 2004
802.431 bln
+36.636 bln
4.78%
jan 1, 2005
932.655 bln
+130.224 bln
16.23%
jan 1, 2006
1.038 trl
+105.159 bln
11.28%
jan 1, 2007
1.106 trl
+67.781 bln
6.53%
jan 1, 2008
1.265 trl
+159.662 bln
14.44%
jan 1, 2009
1.324 trl
+59.12 bln
4.67%
jan 1, 2010
1.372 trl
+48.12 bln
3.63%
jan 1, 2011
1.145 trl
-227.799 bln
-16.6%
jan 1, 2012
1.141 trl
-3.624 bln
-0.32%
jan 1, 2013
1.381 trl
+240.211 bln
21.05%
jan 1, 2014
1.646 trl
+264.899 bln
19.18%
jan 1, 2015
1.871 trl
+225.213 bln
13.68%
jan 1, 2016
2.072 trl
+200.569 bln
10.72%
Ranking of countries by current statistics by years


Comments: