29
/
en
AIzaSyAYiBZKx7MnpbEhh9jyipgxe19OcubqV5w
April 1, 2024
247912
Spain
ESP
true
2
1
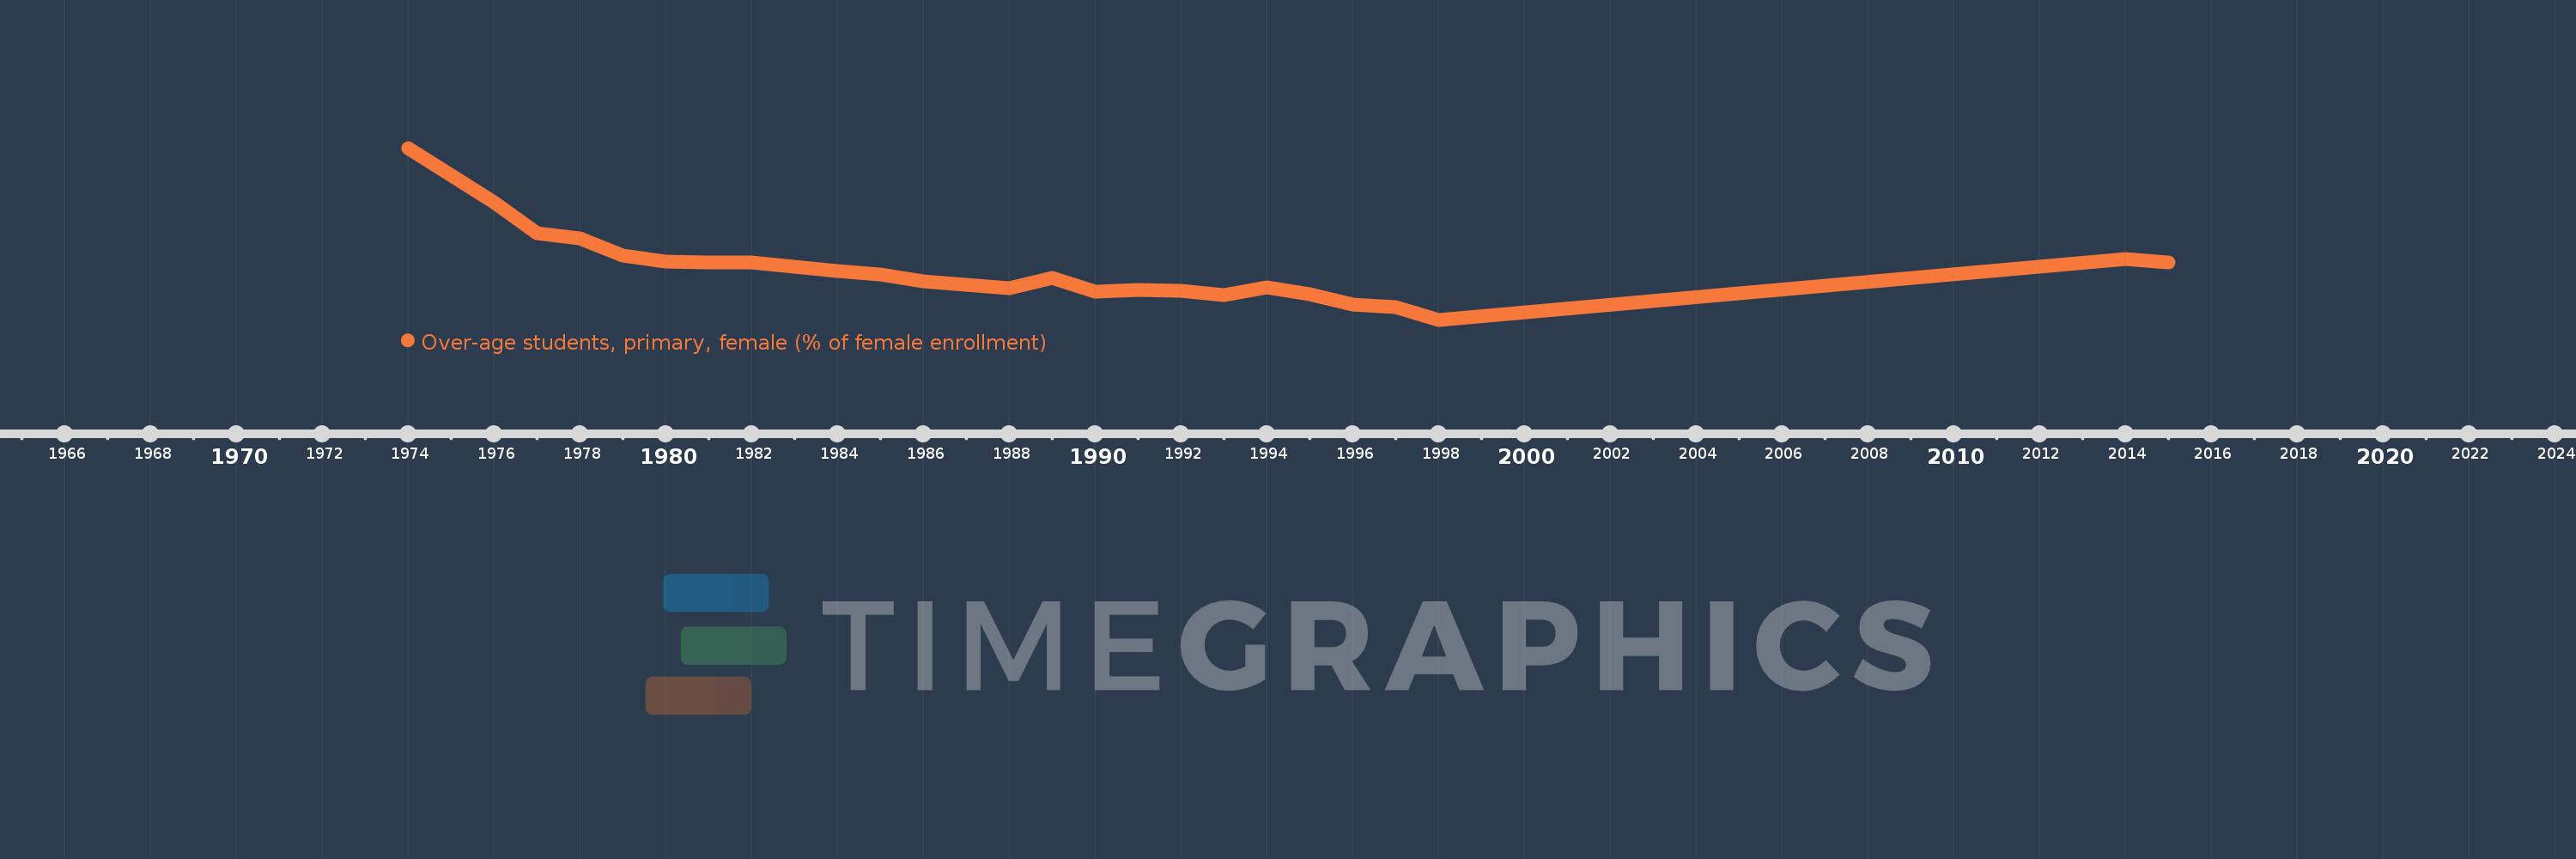
Over-age students, primary, female (% of female enrollment)
2015,2014,1998,1997,1996,1995,1994,1993,1992,1991,1990,1989,1988,1987,1986,1985,1984,1982,1981,1980,1979,1978,1977,1976,1974
This statistics in other country:
AfghanistanAlbaniaAlgeriaAndorraAngolaAntigua and BarbudaArgentinaArubaAustraliaAustriaAzerbaijanBahamas, TheBahrainBangladeshBarbadosBelarusBelgiumBelizeBeninBermudaBhutanBoliviaBosnia and HerzegovinaBotswanaBritish Virgin IslandsBrunei DarussalamBulgariaBurkina FasoBurundiCabo VerdeCambodiaCameroonCanadaCentral African RepublicChadChileChinaColombiaComorosCongo, Dem. Rep.Congo, Rep.Costa RicaCote d'IvoireCubaCyprusDenmarkDjiboutiDominicaDominican RepublicEcuadorEgypt, Arab Rep.El SalvadorEquatorial GuineaEritreaEstoniaEthiopiaFijiFinlandFranceGabonGambia, TheGeorgiaGermanyGhanaGreeceGrenadaGuatemalaGuineaGuinea-BissauGuyanaHaitiHondurasHong Kong SAR, ChinaHungaryIcelandIndiaIndonesiaIran, Islamic Rep.IraqIrelandItalyJamaicaJapanJordanKazakhstanKenyaKiribatiKorea, Dem. People’s Rep.Korea, Rep.KuwaitKyrgyz RepublicLao PDRLebanonLesothoLibyaLuxembourgMacao SAR, ChinaMadagascarMalawiMalaysiaMaldivesMaliMaltaMarshall IslandsMauritaniaMauritiusMexicoMoldovaMongoliaMontenegroMoroccoMozambiqueMyanmarNamibiaNepalNetherlandsNew ZealandNicaraguaNigerNorwayOmanPakistanPalauPanamaParaguayPeruPhilippinesPolandPortugalPuerto RicoQatarRussian FederationRwandaSamoaSao Tome and PrincipeSaudi ArabiaSenegalSerbiaSeychellesSierra LeoneSingaporeSint Maarten (Dutch part)SloveniaSolomon IslandsSomaliaSouth AfricaSouth SudanSpainSri LankaSt. Kitts and NevisSt. LuciaSt. Vincent and the GrenadinesSurinameSwazilandSwedenSwitzerlandSyrian Arab RepublicTajikistanTanzaniaThailandTimor-LesteTogoTongaTrinidad and TobagoTunisiaTurkeyTurks and Caicos IslandsTuvaluUgandaUkraineUnited Arab EmiratesUnited KingdomUnited StatesUruguayVanuatuVenezuela, RBVietnamZambiaZimbabwe Timeline:
This timeline shows a graph from 1974 to 2015 of Spain. No data until 1973. Number of actual observations by date: 25.
Source name:
World Development Indicators
Source organization:
United Nations Educational, Scientific, and Cultural Organization (UNESCO) Institute for Statistics.
Categories, topics:
Education
Last updated:
apr 23, 2017
Indicators value changes by year
Maximum:
12.489
jan 1, 1974
At the date of observation
Value
Absolute change
Change from previous value
jan 1, 1974
12.489
+12.489
0.0%
jan 1, 1976
9.327
-3.162
-25.32%
jan 1, 1977
7.558
-1.769
-18.97%
jan 1, 1978
7.238
-0.32
-4.23%
jan 1, 1979
6.245
-0.993
-13.73%
jan 1, 1980
5.893
-0.351
-5.63%
jan 1, 1981
5.88
-0.013
-0.23%
jan 1, 1982
5.848
-0.032
-0.55%
jan 1, 1984
5.363
-0.485
-8.29%
jan 1, 1985
5.148
-0.215
-4.0%
jan 1, 1986
4.771
-0.377
-7.33%
jan 1, 1987
4.556
-0.215
-4.5%
jan 1, 1988
4.386
-0.17
-3.72%
jan 1, 1989
4.948
+0.562
12.81%
jan 1, 1990
4.182
-0.766
-15.49%
jan 1, 1991
4.293
+0.111
2.67%
jan 1, 1992
4.225
-0.068
-1.59%
jan 1, 1993
3.975
-0.25
-5.92%
jan 1, 1994
4.434
+0.459
11.55%
jan 1, 1995
4.027
-0.407
-9.18%
jan 1, 1996
3.437
-0.59
-14.65%
jan 1, 1997
3.288
-0.149
-4.33%
jan 1, 1998
2.55
-0.739
-22.46%
jan 1, 2014
6.076
+3.526
138.28%
jan 1, 2015
5.844
-0.232
-3.81%
Ranking of countries by current statistics by years


Comments: