29
/
en
AIzaSyAYiBZKx7MnpbEhh9jyipgxe19OcubqV5w
April 1, 2024
208291
Netherlands
NLD
true
2
1
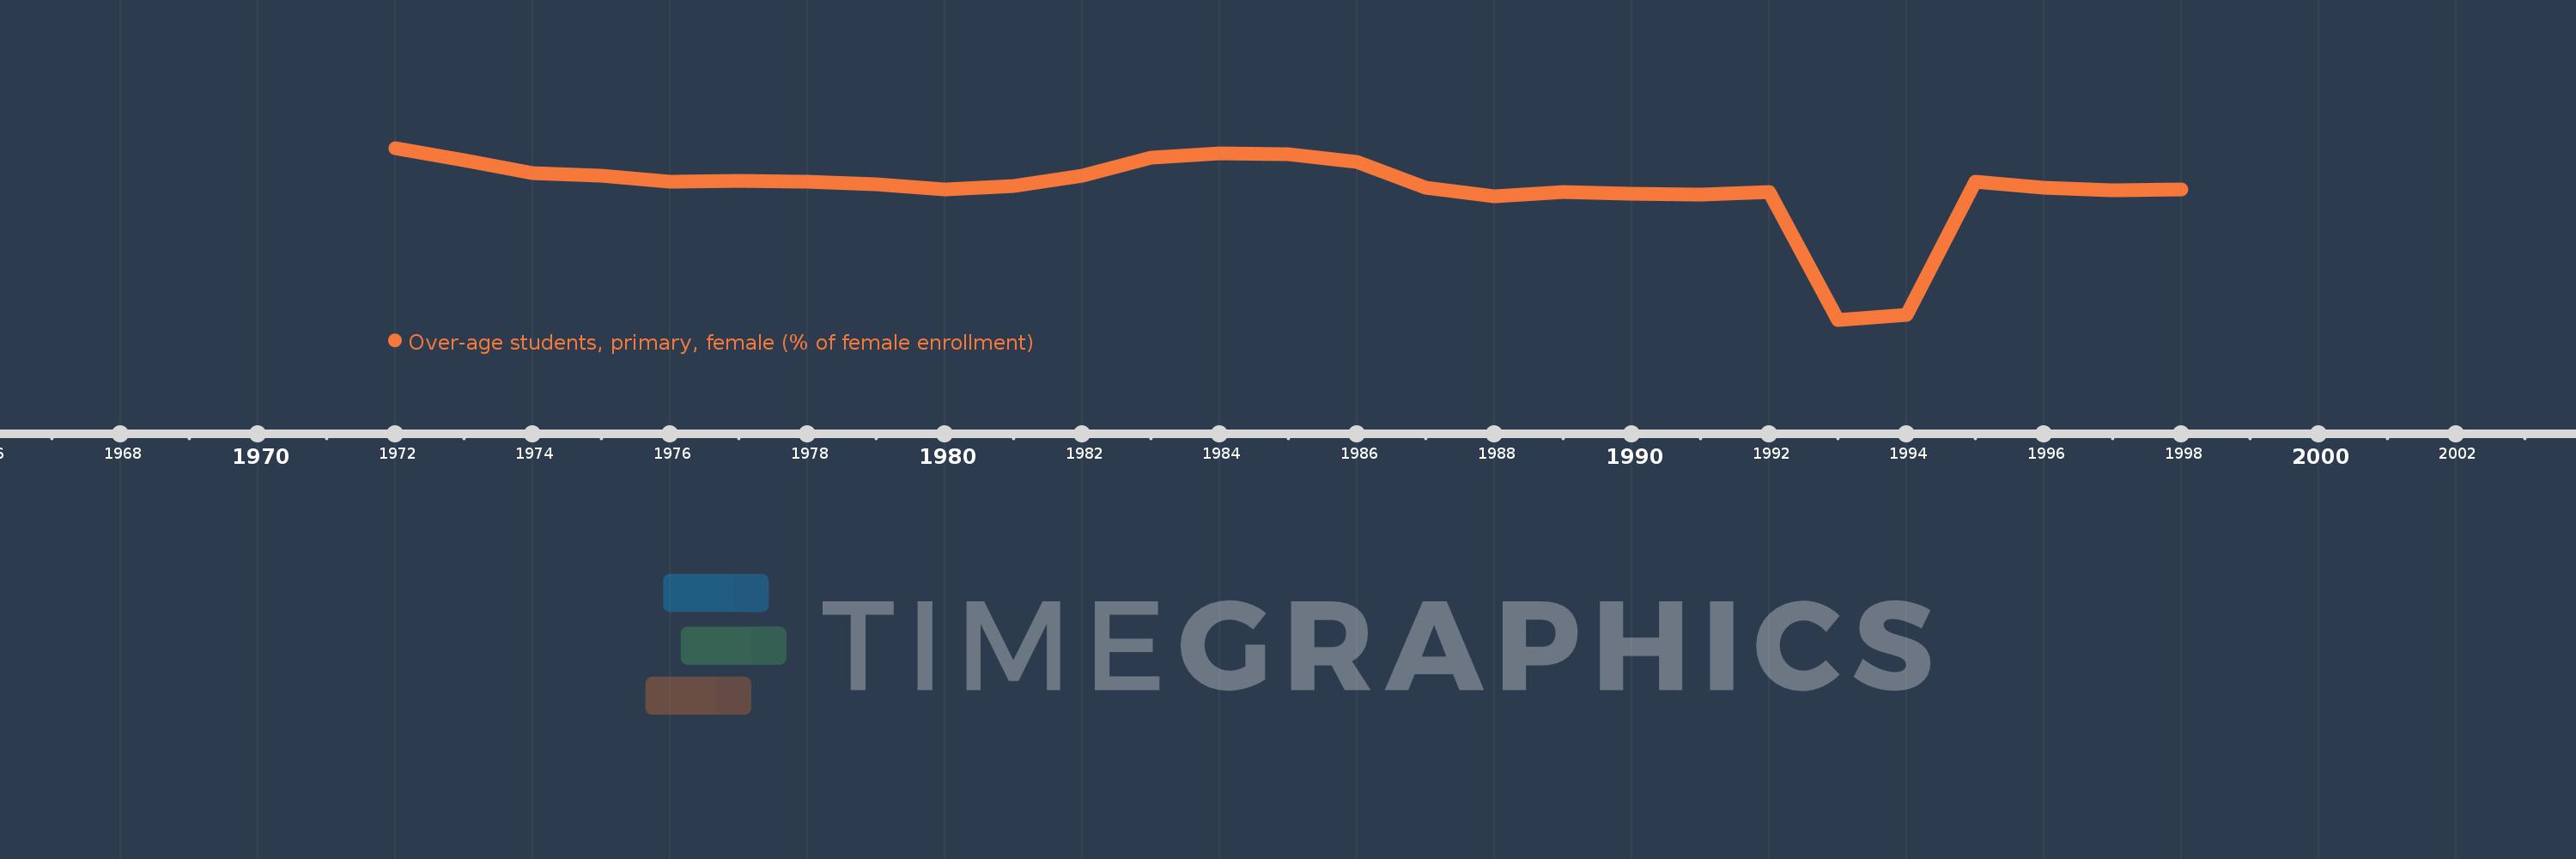
Over-age students, primary, female (% of female enrollment)
1998,1997,1996,1995,1994,1993,1992,1991,1990,1989,1988,1987,1986,1985,1984,1983,1982,1981,1980,1979,1978,1977,1976,1975,1974,1973,1972
This statistics in other country:
AfghanistanAlbaniaAlgeriaAndorraAngolaAntigua and BarbudaArgentinaArubaAustraliaAustriaAzerbaijanBahamas, TheBahrainBangladeshBarbadosBelarusBelgiumBelizeBeninBermudaBhutanBoliviaBosnia and HerzegovinaBotswanaBritish Virgin IslandsBrunei DarussalamBulgariaBurkina FasoBurundiCabo VerdeCambodiaCameroonCanadaCentral African RepublicChadChileChinaColombiaComorosCongo, Dem. Rep.Congo, Rep.Costa RicaCote d'IvoireCubaCyprusDenmarkDjiboutiDominicaDominican RepublicEcuadorEgypt, Arab Rep.El SalvadorEquatorial GuineaEritreaEstoniaEthiopiaFijiFinlandFranceGabonGambia, TheGeorgiaGermanyGhanaGreeceGrenadaGuatemalaGuineaGuinea-BissauGuyanaHaitiHondurasHong Kong SAR, ChinaHungaryIcelandIndiaIndonesiaIran, Islamic Rep.IraqIrelandItalyJamaicaJapanJordanKazakhstanKenyaKiribatiKorea, Dem. People’s Rep.Korea, Rep.KuwaitKyrgyz RepublicLao PDRLebanonLesothoLibyaLuxembourgMacao SAR, ChinaMadagascarMalawiMalaysiaMaldivesMaliMaltaMarshall IslandsMauritaniaMauritiusMexicoMoldovaMongoliaMontenegroMoroccoMozambiqueMyanmarNamibiaNepalNetherlandsNew ZealandNicaraguaNigerNorwayOmanPakistanPalauPanamaParaguayPeruPhilippinesPolandPortugalPuerto RicoQatarRussian FederationRwandaSamoaSao Tome and PrincipeSaudi ArabiaSenegalSerbiaSeychellesSierra LeoneSingaporeSint Maarten (Dutch part)SloveniaSolomon IslandsSomaliaSouth AfricaSouth SudanSpainSri LankaSt. Kitts and NevisSt. LuciaSt. Vincent and the GrenadinesSurinameSwazilandSwedenSwitzerlandSyrian Arab RepublicTajikistanTanzaniaThailandTimor-LesteTogoTongaTrinidad and TobagoTunisiaTurkeyTurks and Caicos IslandsTuvaluUgandaUkraineUnited Arab EmiratesUnited KingdomUnited StatesUruguayVanuatuVenezuela, RBVietnamZambiaZimbabwe Timeline:
This timeline shows a graph from 1972 to 1998 of Netherlands. No data until 1971. Number of actual observations by date: 27.
Source name:
World Development Indicators
Source organization:
United Nations Educational, Scientific, and Cultural Organization (UNESCO) Institute for Statistics.
Categories, topics:
Education
Last updated:
apr 23, 2017
Indicators value changes by year
At the date of observation
Value
Absolute change
Change from previous value
jan 1, 1972
7.825
+7.825
0.0%
jan 1, 1973
7.477
-0.348
-4.45%
jan 1, 1974
7.103
-0.374
-5.0%
jan 1, 1975
7.024
-0.079
-1.12%
jan 1, 1976
6.845
-0.179
-2.54%
jan 1, 1977
6.879
+0.034
0.5%
jan 1, 1978
6.855
-0.024
-0.35%
jan 1, 1979
6.763
-0.092
-1.34%
jan 1, 1980
6.624
-0.139
-2.06%
jan 1, 1981
6.724
+0.101
1.52%
jan 1, 1982
7.021
+0.297
4.41%
jan 1, 1983
7.551
+0.53
7.55%
jan 1, 1984
7.674
+0.123
1.63%
jan 1, 1985
7.65
-0.024
-0.31%
jan 1, 1986
7.416
-0.234
-3.06%
jan 1, 1987
6.668
-0.748
-10.09%
jan 1, 1988
6.43
-0.237
-3.56%
jan 1, 1989
6.553
+0.122
1.9%
jan 1, 1990
6.499
-0.054
-0.83%
jan 1, 1991
6.479
-0.019
-0.3%
jan 1, 1992
6.558
+0.078
1.21%
jan 1, 1993
2.838
-3.72
-56.73%
jan 1, 1994
2.983
+0.145
5.1%
jan 1, 1995
6.857
+3.874
129.9%
jan 1, 1996
6.664
-0.193
-2.81%
jan 1, 1997
6.6
-0.064
-0.96%
jan 1, 1998
6.622
+0.022
0.34%
Ranking of countries by current statistics by years


Comments: