29
/
en
AIzaSyAYiBZKx7MnpbEhh9jyipgxe19OcubqV5w
April 1, 2024
102847
Central African Republic
CAF
true
2
1
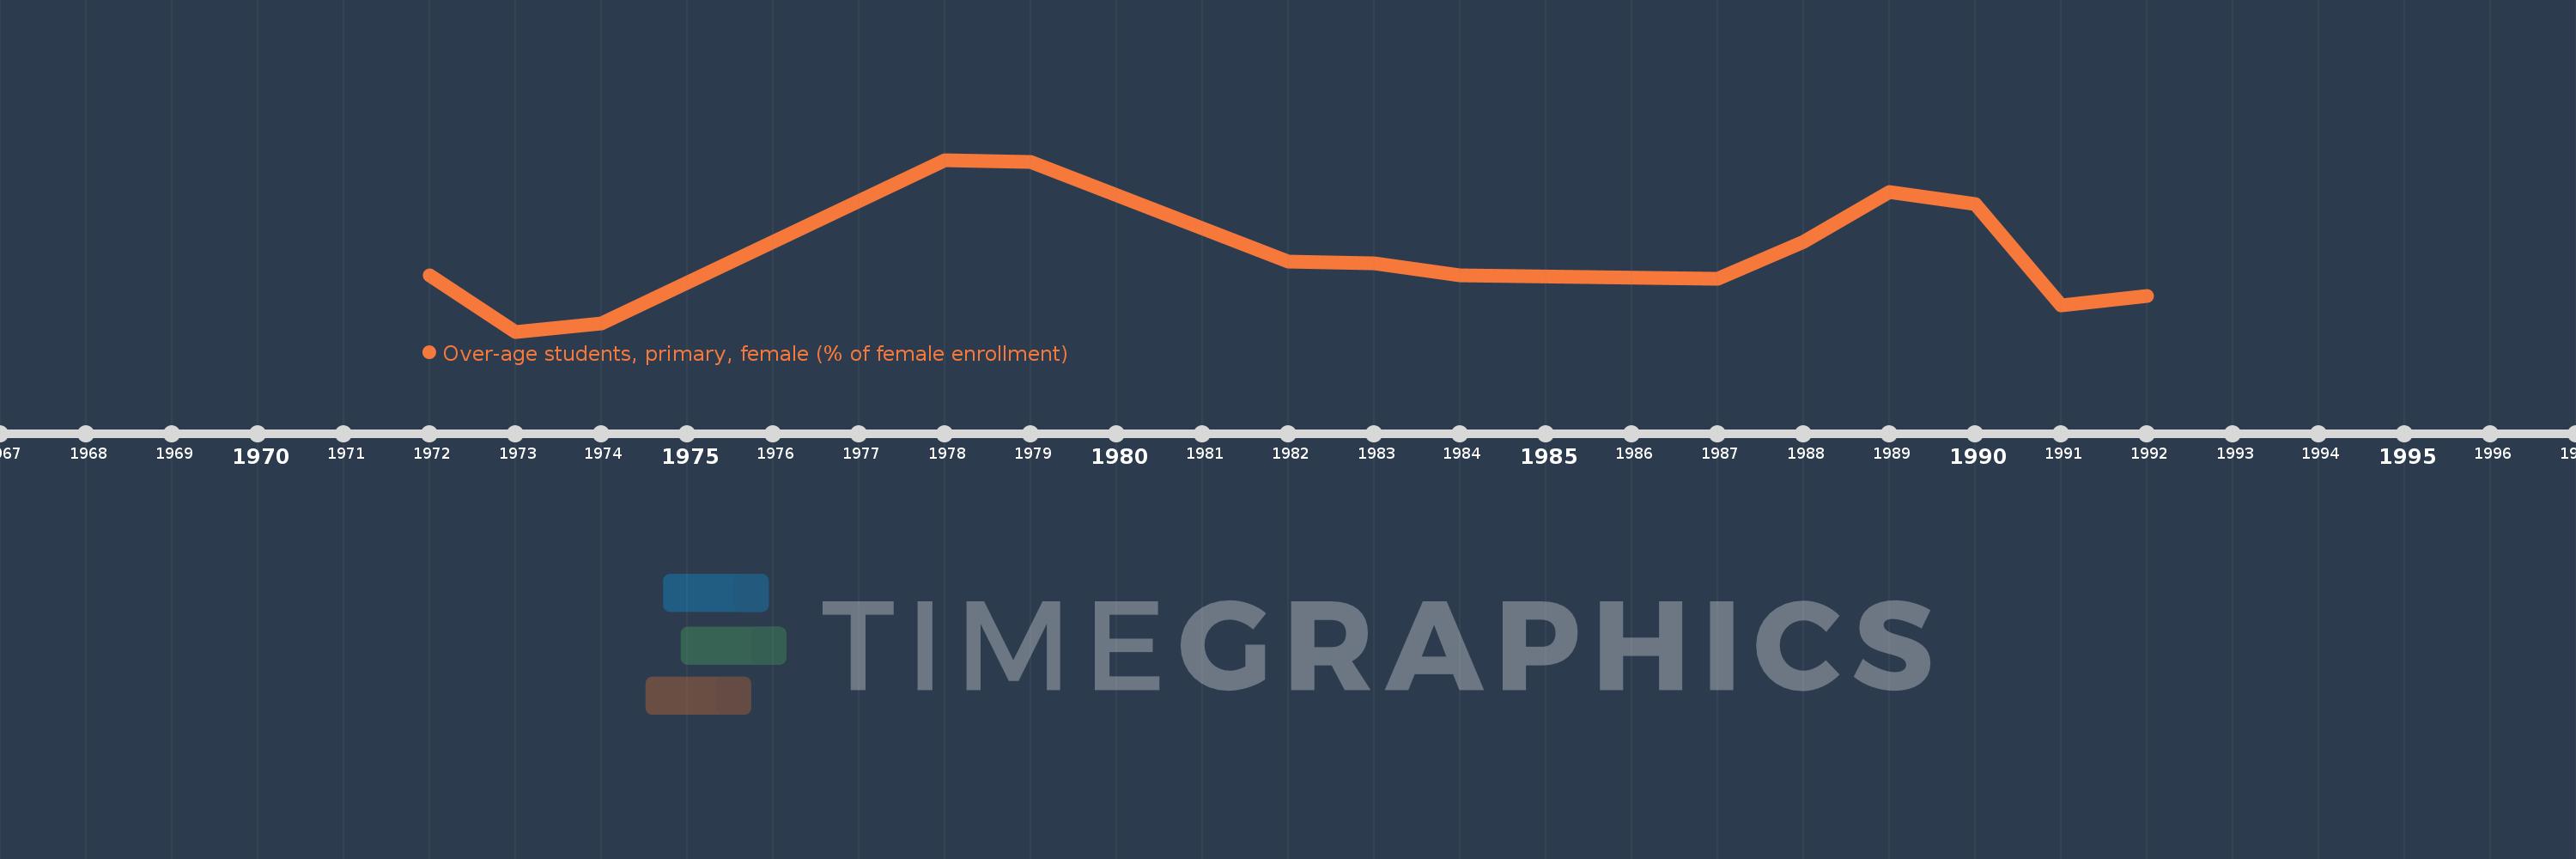
Over-age students, primary, female (% of female enrollment)
1992,1991,1990,1989,1988,1987,1984,1983,1982,1979,1978,1974,1973,1972
This statistics in other country:
AfghanistanAlbaniaAlgeriaAndorraAngolaAntigua and BarbudaArgentinaArubaAustraliaAustriaAzerbaijanBahamas, TheBahrainBangladeshBarbadosBelarusBelgiumBelizeBeninBermudaBhutanBoliviaBosnia and HerzegovinaBotswanaBritish Virgin IslandsBrunei DarussalamBulgariaBurkina FasoBurundiCabo VerdeCambodiaCameroonCanadaCentral African RepublicChadChileChinaColombiaComorosCongo, Dem. Rep.Congo, Rep.Costa RicaCote d'IvoireCubaCyprusDenmarkDjiboutiDominicaDominican RepublicEcuadorEgypt, Arab Rep.El SalvadorEquatorial GuineaEritreaEstoniaEthiopiaFijiFinlandFranceGabonGambia, TheGeorgiaGermanyGhanaGreeceGrenadaGuatemalaGuineaGuinea-BissauGuyanaHaitiHondurasHong Kong SAR, ChinaHungaryIcelandIndiaIndonesiaIran, Islamic Rep.IraqIrelandItalyJamaicaJapanJordanKazakhstanKenyaKiribatiKorea, Dem. People’s Rep.Korea, Rep.KuwaitKyrgyz RepublicLao PDRLebanonLesothoLibyaLuxembourgMacao SAR, ChinaMadagascarMalawiMalaysiaMaldivesMaliMaltaMarshall IslandsMauritaniaMauritiusMexicoMoldovaMongoliaMontenegroMoroccoMozambiqueMyanmarNamibiaNepalNetherlandsNew ZealandNicaraguaNigerNorwayOmanPakistanPalauPanamaParaguayPeruPhilippinesPolandPortugalPuerto RicoQatarRussian FederationRwandaSamoaSao Tome and PrincipeSaudi ArabiaSenegalSerbiaSeychellesSierra LeoneSingaporeSint Maarten (Dutch part)SloveniaSolomon IslandsSomaliaSouth AfricaSouth SudanSpainSri LankaSt. Kitts and NevisSt. LuciaSt. Vincent and the GrenadinesSurinameSwazilandSwedenSwitzerlandSyrian Arab RepublicTajikistanTanzaniaThailandTimor-LesteTogoTongaTrinidad and TobagoTunisiaTurkeyTurks and Caicos IslandsTuvaluUgandaUkraineUnited Arab EmiratesUnited KingdomUnited StatesUruguayVanuatuVenezuela, RBVietnamZambiaZimbabwe Timeline:
This timeline shows a graph from 1972 to 1992 of Central African Republic. No data until 1971. Number of actual observations by date: 14.
Source name:
World Development Indicators
Source organization:
United Nations Educational, Scientific, and Cultural Organization (UNESCO) Institute for Statistics.
Categories, topics:
Education
Last updated:
apr 23, 2017
Indicators value changes by year
Minimum:
13.705
jan 1, 1973
Maximum:
25.602
jan 1, 1978
At the date of observation
Value
Absolute change
Change from previous value
jan 1, 1972
17.576
+17.576
0.0%
jan 1, 1973
13.705
-3.871
-22.02%
jan 1, 1974
14.267
+0.562
4.1%
jan 1, 1978
25.602
+11.334
79.44%
jan 1, 1979
25.474
-0.128
-0.5%
jan 1, 1982
18.582
-6.892
-27.05%
jan 1, 1983
18.406
-0.177
-0.95%
jan 1, 1984
17.59
-0.816
-4.43%
jan 1, 1987
17.386
-0.203
-1.16%
jan 1, 1988
19.92
+2.533
14.57%
jan 1, 1989
23.347
+3.428
17.21%
jan 1, 1990
22.561
-0.787
-3.37%
jan 1, 1991
15.549
-7.012
-31.08%
jan 1, 1992
16.146
+0.598
3.84%
Ranking of countries by current statistics by years


Comments: