29
/
en
AIzaSyAYiBZKx7MnpbEhh9jyipgxe19OcubqV5w
April 1, 2024
209650
New Zealand
NZL
true
2
1
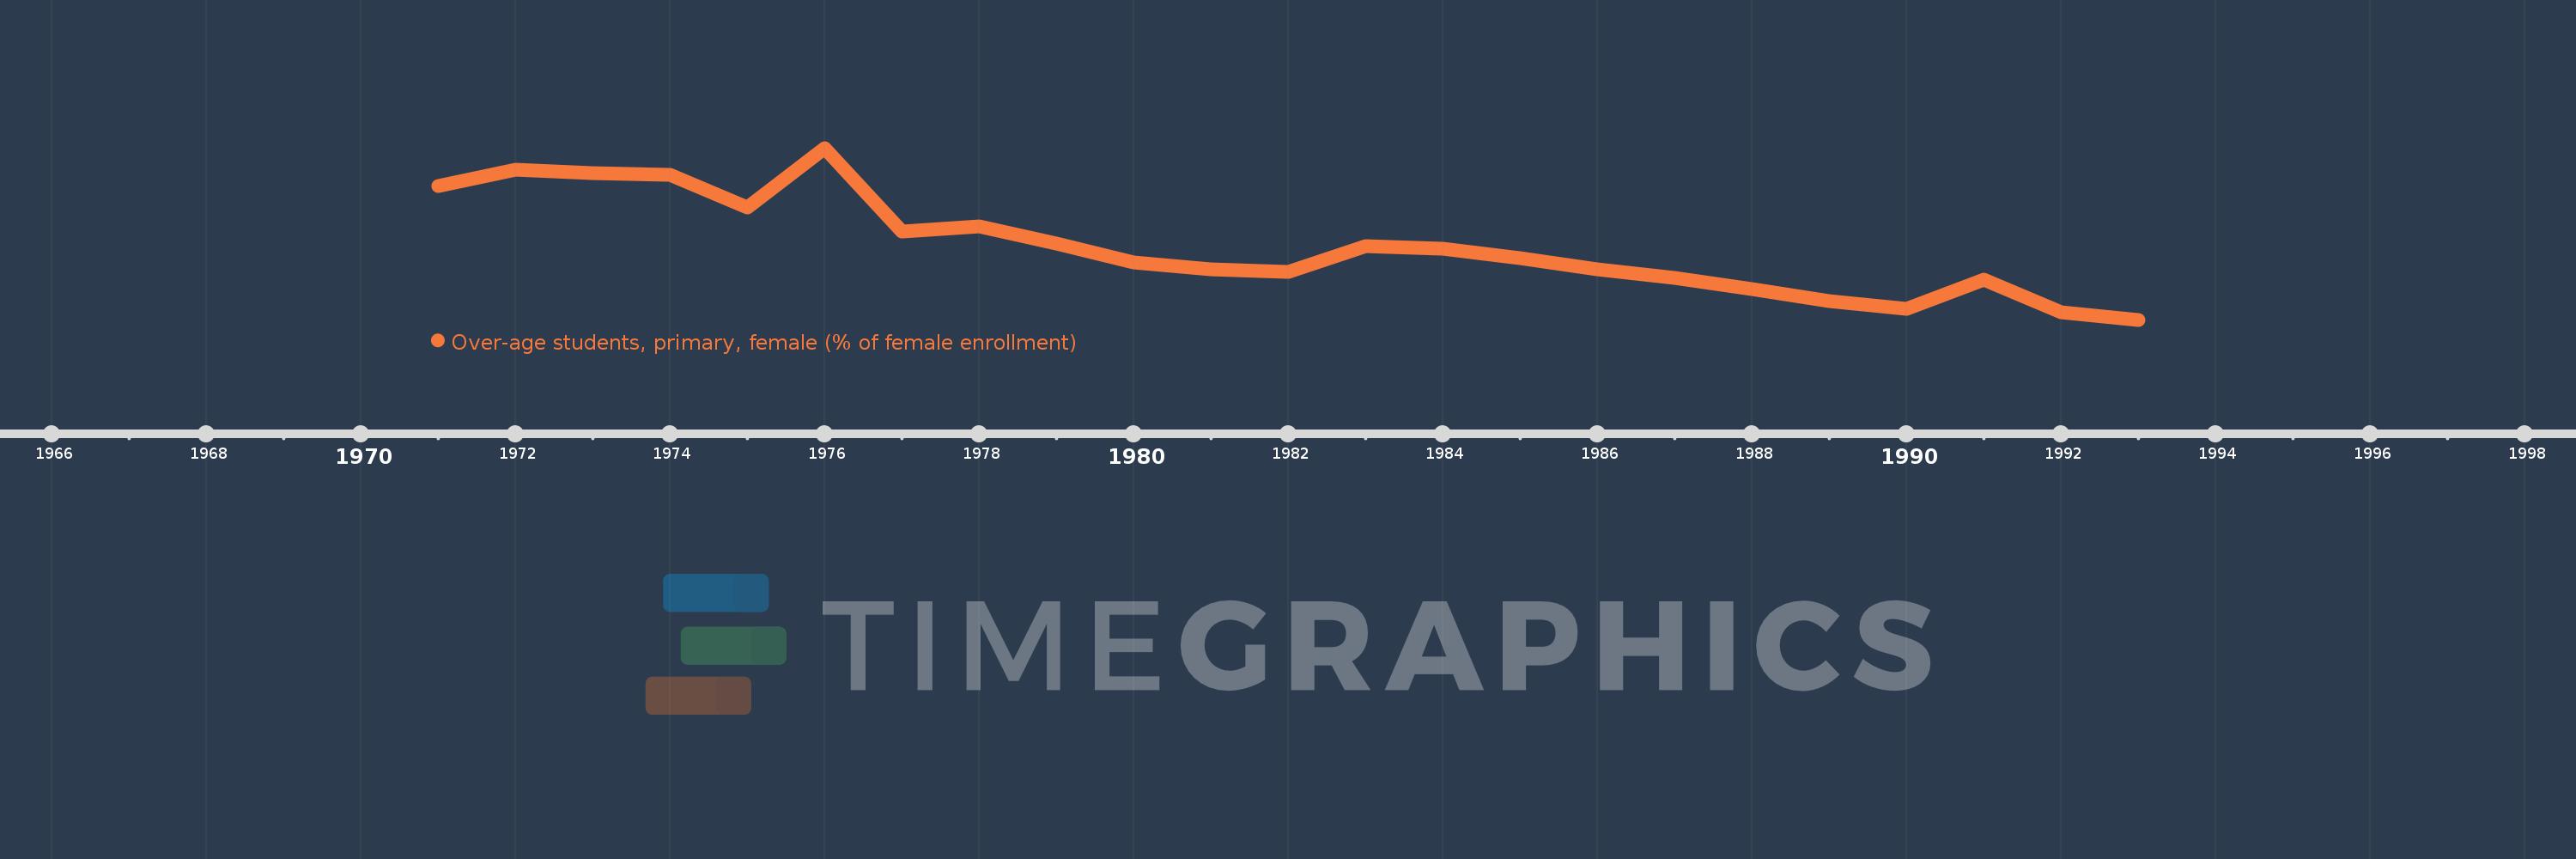
Over-age students, primary, female (% of female enrollment)
1993,1992,1991,1990,1989,1988,1987,1986,1985,1984,1983,1982,1981,1980,1979,1978,1977,1976,1975,1974,1973,1972,1971
This statistics in other country:
AfghanistanAlbaniaAlgeriaAndorraAngolaAntigua and BarbudaArgentinaArubaAustraliaAustriaAzerbaijanBahamas, TheBahrainBangladeshBarbadosBelarusBelgiumBelizeBeninBermudaBhutanBoliviaBosnia and HerzegovinaBotswanaBritish Virgin IslandsBrunei DarussalamBulgariaBurkina FasoBurundiCabo VerdeCambodiaCameroonCanadaCentral African RepublicChadChileChinaColombiaComorosCongo, Dem. Rep.Congo, Rep.Costa RicaCote d'IvoireCubaCyprusDenmarkDjiboutiDominicaDominican RepublicEcuadorEgypt, Arab Rep.El SalvadorEquatorial GuineaEritreaEstoniaEthiopiaFijiFinlandFranceGabonGambia, TheGeorgiaGermanyGhanaGreeceGrenadaGuatemalaGuineaGuinea-BissauGuyanaHaitiHondurasHong Kong SAR, ChinaHungaryIcelandIndiaIndonesiaIran, Islamic Rep.IraqIrelandItalyJamaicaJapanJordanKazakhstanKenyaKiribatiKorea, Dem. People’s Rep.Korea, Rep.KuwaitKyrgyz RepublicLao PDRLebanonLesothoLibyaLuxembourgMacao SAR, ChinaMadagascarMalawiMalaysiaMaldivesMaliMaltaMarshall IslandsMauritaniaMauritiusMexicoMoldovaMongoliaMontenegroMoroccoMozambiqueMyanmarNamibiaNepalNetherlandsNew ZealandNicaraguaNigerNorwayOmanPakistanPalauPanamaParaguayPeruPhilippinesPolandPortugalPuerto RicoQatarRussian FederationRwandaSamoaSao Tome and PrincipeSaudi ArabiaSenegalSerbiaSeychellesSierra LeoneSingaporeSint Maarten (Dutch part)SloveniaSolomon IslandsSomaliaSouth AfricaSouth SudanSpainSri LankaSt. Kitts and NevisSt. LuciaSt. Vincent and the GrenadinesSurinameSwazilandSwedenSwitzerlandSyrian Arab RepublicTajikistanTanzaniaThailandTimor-LesteTogoTongaTrinidad and TobagoTunisiaTurkeyTurks and Caicos IslandsTuvaluUgandaUkraineUnited Arab EmiratesUnited KingdomUnited StatesUruguayVanuatuVenezuela, RBVietnamZambiaZimbabwe Timeline:
This timeline shows a graph from 1971 to 1993 of New Zealand. No data until 1970. Number of actual observations by date: 23.
Source name:
World Development Indicators
Source organization:
United Nations Educational, Scientific, and Cultural Organization (UNESCO) Institute for Statistics.
Categories, topics:
Education
Last updated:
apr 23, 2017
Indicators value changes by year
At the date of observation
Value
Absolute change
Change from previous value
jan 1, 1971
5.046
+5.046
0.0%
jan 1, 1972
5.29
+0.244
4.83%
jan 1, 1973
5.243
-0.048
-0.9%
jan 1, 1974
5.219
-0.023
-0.45%
jan 1, 1975
4.726
-0.493
-9.45%
jan 1, 1976
5.623
+0.897
18.98%
jan 1, 1977
4.359
-1.264
-22.48%
jan 1, 1978
4.444
+0.085
1.96%
jan 1, 1979
4.182
-0.262
-5.91%
jan 1, 1980
3.899
-0.283
-6.77%
jan 1, 1981
3.793
-0.105
-2.7%
jan 1, 1982
3.76
-0.034
-0.88%
jan 1, 1983
4.14
+0.38
10.12%
jan 1, 1984
4.101
-0.04
-0.96%
jan 1, 1985
3.955
-0.145
-3.55%
jan 1, 1986
3.793
-0.162
-4.1%
jan 1, 1987
3.657
-0.136
-3.59%
jan 1, 1988
3.499
-0.157
-4.3%
jan 1, 1989
3.308
-0.191
-5.47%
jan 1, 1990
3.192
-0.116
-3.52%
jan 1, 1991
3.643
+0.451
14.13%
jan 1, 1992
3.143
-0.499
-13.71%
jan 1, 1993
3.032
-0.111
-3.53%
Ranking of countries by current statistics by years


Comments: