29
/
en
AIzaSyAYiBZKx7MnpbEhh9jyipgxe19OcubqV5w
April 1, 2024
123939
Ecuador
ECU
true
2
1
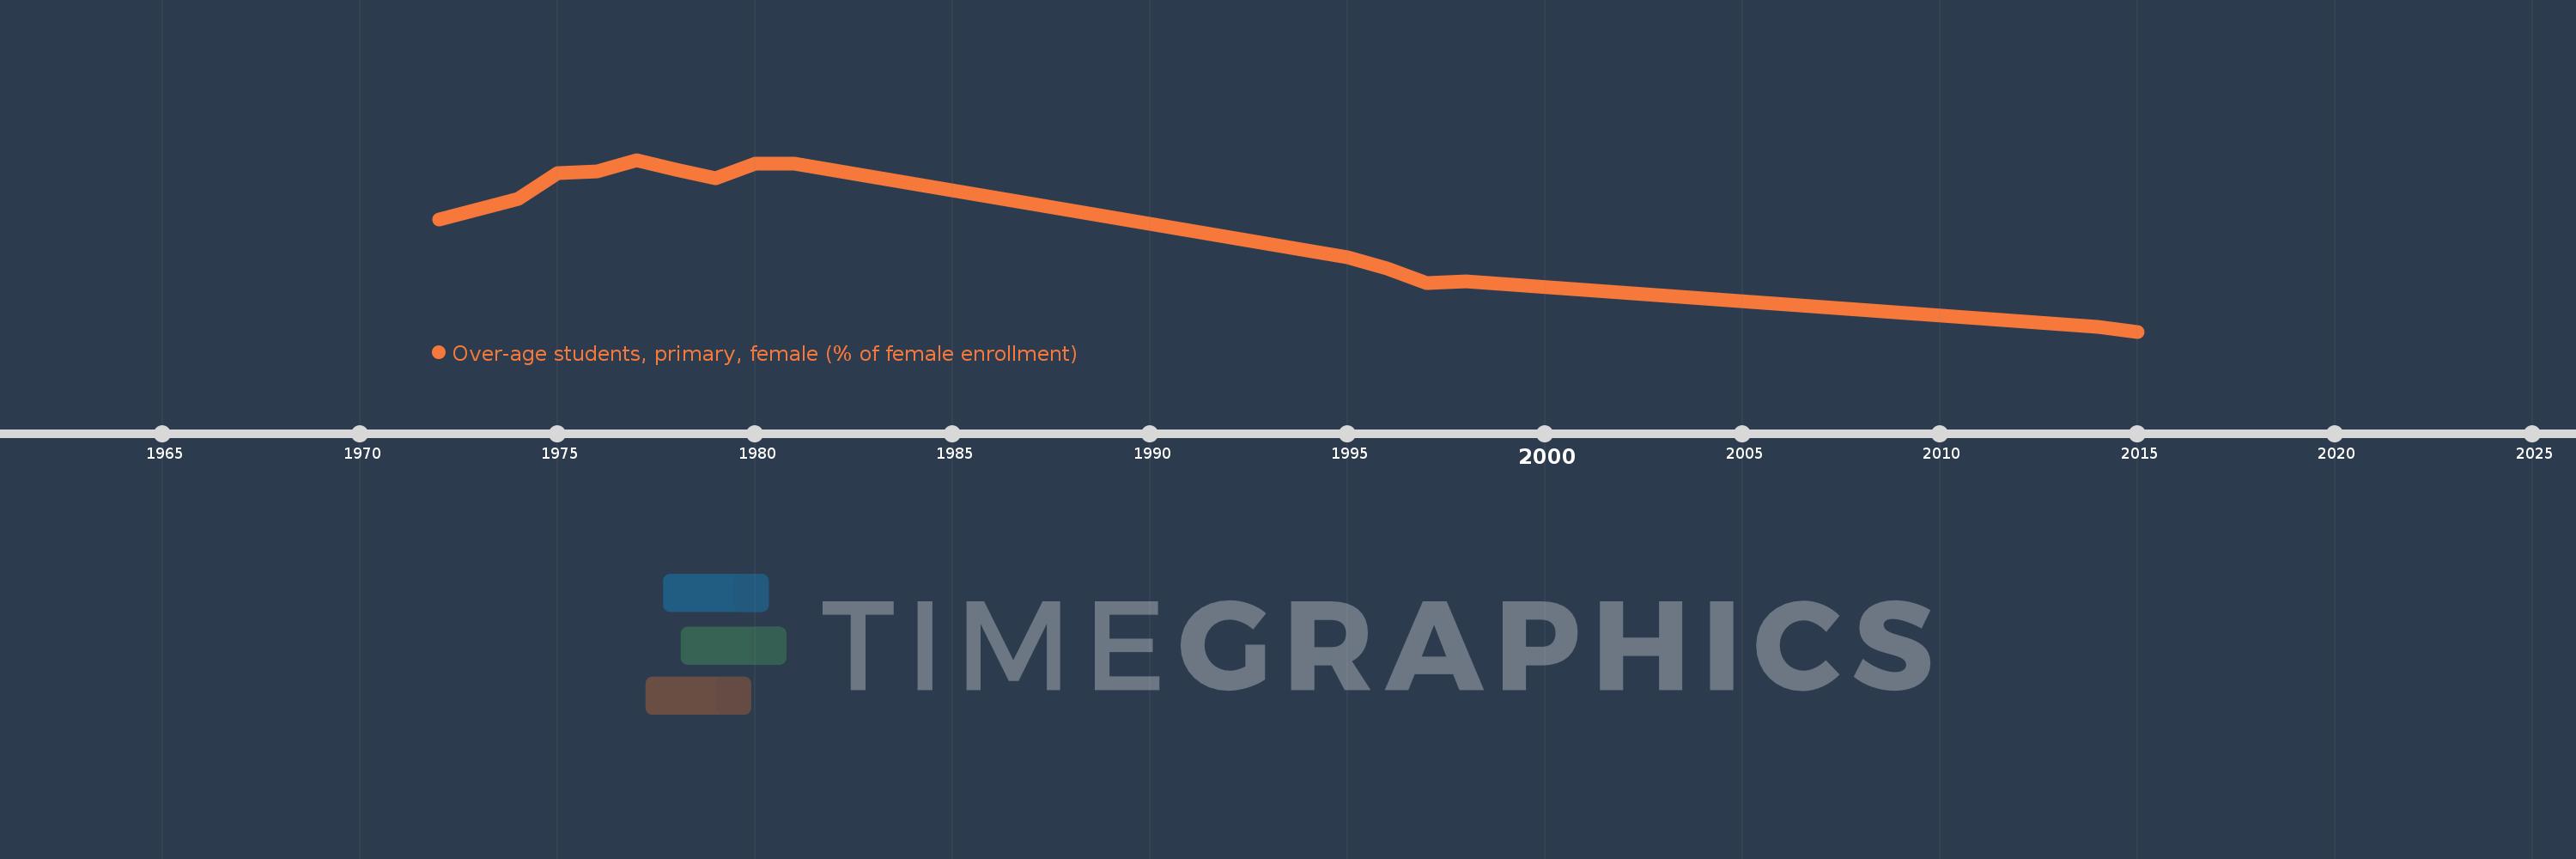
Over-age students, primary, female (% of female enrollment)
2015,2014,1998,1997,1996,1995,1981,1980,1979,1978,1977,1976,1975,1974,1972
This statistics in other country:
AfghanistanAlbaniaAlgeriaAndorraAngolaAntigua and BarbudaArgentinaArubaAustraliaAustriaAzerbaijanBahamas, TheBahrainBangladeshBarbadosBelarusBelgiumBelizeBeninBermudaBhutanBoliviaBosnia and HerzegovinaBotswanaBritish Virgin IslandsBrunei DarussalamBulgariaBurkina FasoBurundiCabo VerdeCambodiaCameroonCanadaCentral African RepublicChadChileChinaColombiaComorosCongo, Dem. Rep.Congo, Rep.Costa RicaCote d'IvoireCubaCyprusDenmarkDjiboutiDominicaDominican RepublicEcuadorEgypt, Arab Rep.El SalvadorEquatorial GuineaEritreaEstoniaEthiopiaFijiFinlandFranceGabonGambia, TheGeorgiaGermanyGhanaGreeceGrenadaGuatemalaGuineaGuinea-BissauGuyanaHaitiHondurasHong Kong SAR, ChinaHungaryIcelandIndiaIndonesiaIran, Islamic Rep.IraqIrelandItalyJamaicaJapanJordanKazakhstanKenyaKiribatiKorea, Dem. People’s Rep.Korea, Rep.KuwaitKyrgyz RepublicLao PDRLebanonLesothoLibyaLuxembourgMacao SAR, ChinaMadagascarMalawiMalaysiaMaldivesMaliMaltaMarshall IslandsMauritaniaMauritiusMexicoMoldovaMongoliaMontenegroMoroccoMozambiqueMyanmarNamibiaNepalNetherlandsNew ZealandNicaraguaNigerNorwayOmanPakistanPalauPanamaParaguayPeruPhilippinesPolandPortugalPuerto RicoQatarRussian FederationRwandaSamoaSao Tome and PrincipeSaudi ArabiaSenegalSerbiaSeychellesSierra LeoneSingaporeSint Maarten (Dutch part)SloveniaSolomon IslandsSomaliaSouth AfricaSouth SudanSpainSri LankaSt. Kitts and NevisSt. LuciaSt. Vincent and the GrenadinesSurinameSwazilandSwedenSwitzerlandSyrian Arab RepublicTajikistanTanzaniaThailandTimor-LesteTogoTongaTrinidad and TobagoTunisiaTurkeyTurks and Caicos IslandsTuvaluUgandaUkraineUnited Arab EmiratesUnited KingdomUnited StatesUruguayVanuatuVenezuela, RBVietnamZambiaZimbabwe Timeline:
This timeline shows a graph from 1972 to 2015 of Ecuador. No data until 1971. Number of actual observations by date: 15.
Source name:
World Development Indicators
Source organization:
United Nations Educational, Scientific, and Cultural Organization (UNESCO) Institute for Statistics.
Categories, topics:
Education
Last updated:
apr 23, 2017
Indicators value changes by year
Maximum:
19.875
jan 1, 1977
At the date of observation
Value
Absolute change
Change from previous value
jan 1, 1972
15.87
+15.87
0.0%
jan 1, 1974
17.252
+1.382
8.71%
jan 1, 1975
18.994
+1.743
10.1%
jan 1, 1976
19.097
+0.103
0.54%
jan 1, 1977
19.875
+0.777
4.07%
jan 1, 1978
19.21
-0.665
-3.34%
jan 1, 1979
18.653
-0.557
-2.9%
jan 1, 1980
19.642
+0.989
5.3%
jan 1, 1981
19.637
-0.005
-0.03%
jan 1, 1995
13.344
-6.293
-32.05%
jan 1, 1996
12.628
-0.715
-5.36%
jan 1, 1997
11.648
-0.981
-7.77%
jan 1, 1998
11.756
+0.109
0.93%
jan 1, 2014
8.745
-3.011
-25.62%
jan 1, 2015
8.402
-0.343
-3.92%
Ranking of countries by current statistics by years


Comments: