29
/
en
AIzaSyAYiBZKx7MnpbEhh9jyipgxe19OcubqV5w
April 1, 2024
90232
Botswana
BWA
true
2
1
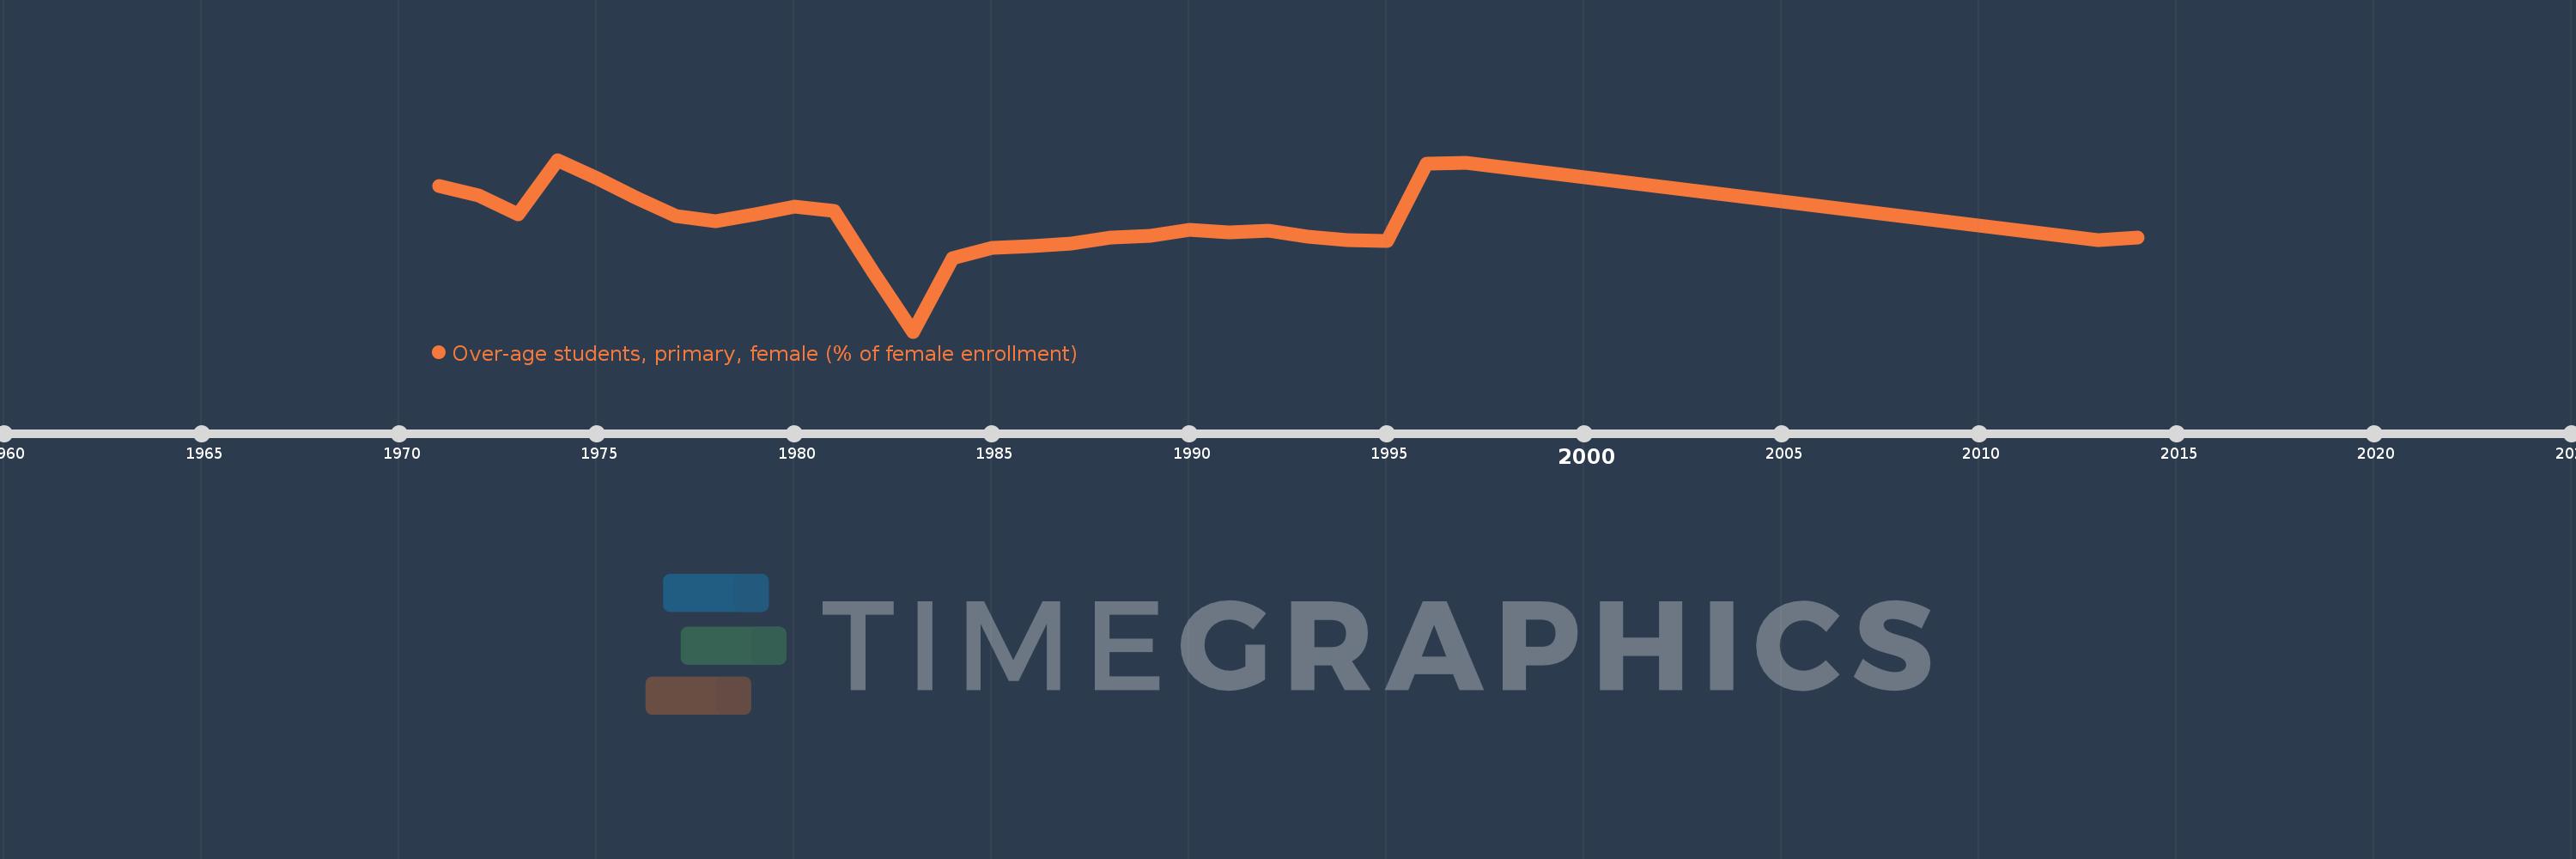
Over-age students, primary, female (% of female enrollment)
2014,2013,1997,1996,1995,1994,1993,1992,1991,1990,1989,1988,1987,1986,1985,1984,1983,1982,1981,1980,1979,1978,1977,1976,1975,1974,1973,1972,1971
This statistics in other country:
AfghanistanAlbaniaAlgeriaAndorraAngolaAntigua and BarbudaArgentinaArubaAustraliaAustriaAzerbaijanBahamas, TheBahrainBangladeshBarbadosBelarusBelgiumBelizeBeninBermudaBhutanBoliviaBosnia and HerzegovinaBotswanaBritish Virgin IslandsBrunei DarussalamBulgariaBurkina FasoBurundiCabo VerdeCambodiaCameroonCanadaCentral African RepublicChadChileChinaColombiaComorosCongo, Dem. Rep.Congo, Rep.Costa RicaCote d'IvoireCubaCyprusDenmarkDjiboutiDominicaDominican RepublicEcuadorEgypt, Arab Rep.El SalvadorEquatorial GuineaEritreaEstoniaEthiopiaFijiFinlandFranceGabonGambia, TheGeorgiaGermanyGhanaGreeceGrenadaGuatemalaGuineaGuinea-BissauGuyanaHaitiHondurasHong Kong SAR, ChinaHungaryIcelandIndiaIndonesiaIran, Islamic Rep.IraqIrelandItalyJamaicaJapanJordanKazakhstanKenyaKiribatiKorea, Dem. People’s Rep.Korea, Rep.KuwaitKyrgyz RepublicLao PDRLebanonLesothoLibyaLuxembourgMacao SAR, ChinaMadagascarMalawiMalaysiaMaldivesMaliMaltaMarshall IslandsMauritaniaMauritiusMexicoMoldovaMongoliaMontenegroMoroccoMozambiqueMyanmarNamibiaNepalNetherlandsNew ZealandNicaraguaNigerNorwayOmanPakistanPalauPanamaParaguayPeruPhilippinesPolandPortugalPuerto RicoQatarRussian FederationRwandaSamoaSao Tome and PrincipeSaudi ArabiaSenegalSerbiaSeychellesSierra LeoneSingaporeSint Maarten (Dutch part)SloveniaSolomon IslandsSomaliaSouth AfricaSouth SudanSpainSri LankaSt. Kitts and NevisSt. LuciaSt. Vincent and the GrenadinesSurinameSwazilandSwedenSwitzerlandSyrian Arab RepublicTajikistanTanzaniaThailandTimor-LesteTogoTongaTrinidad and TobagoTunisiaTurkeyTurks and Caicos IslandsTuvaluUgandaUkraineUnited Arab EmiratesUnited KingdomUnited StatesUruguayVanuatuVenezuela, RBVietnamZambiaZimbabwe Timeline:
This timeline shows a graph from 1971 to 2014 of Botswana. No data until 1970. Number of actual observations by date: 29.
Source name:
World Development Indicators
Source organization:
United Nations Educational, Scientific, and Cultural Organization (UNESCO) Institute for Statistics.
Categories, topics:
Education
Last updated:
apr 23, 2017
Indicators value changes by year
Maximum:
23.706
jan 1, 1974
At the date of observation
Value
Absolute change
Change from previous value
jan 1, 1971
20.101
+20.101
0.0%
jan 1, 1972
18.838
-1.263
-6.28%
jan 1, 1973
16.206
-2.632
-13.97%
jan 1, 1974
23.706
+7.499
46.27%
jan 1, 1975
21.159
-2.546
-10.74%
jan 1, 1976
18.38
-2.779
-13.13%
jan 1, 1977
15.942
-2.438
-13.26%
jan 1, 1978
15.231
-0.712
-4.46%
jan 1, 1979
16.142
+0.911
5.98%
jan 1, 1980
17.29
+1.147
7.11%
jan 1, 1981
16.711
-0.578
-3.34%
jan 1, 1982
8.118
-8.593
-51.42%
jan 1, 1983
0.0
-8.118
-100.0%
jan 1, 1984
10.154
+10.154
%
jan 1, 1985
11.509
+1.355
13.35%
jan 1, 1986
11.799
+0.29
2.52%
jan 1, 1987
12.179
+0.379
3.21%
jan 1, 1988
12.923
+0.744
6.11%
jan 1, 1989
13.261
+0.339
2.62%
jan 1, 1990
14.041
+0.78
5.88%
jan 1, 1991
13.691
-0.35
-2.49%
jan 1, 1992
13.95
+0.259
1.89%
jan 1, 1993
13.103
-0.847
-6.07%
jan 1, 1994
12.614
-0.49
-3.74%
jan 1, 1995
12.529
-0.085
-0.67%
jan 1, 1996
23.204
+10.675
85.2%
jan 1, 1997
23.279
+0.075
0.32%
jan 1, 2013
12.651
-10.628
-45.65%
jan 1, 2014
12.927
+0.276
2.18%
Ranking of countries by current statistics by years


Comments: