29
/
en
AIzaSyAYiBZKx7MnpbEhh9jyipgxe19OcubqV5w
April 1, 2024
267246
Trinidad and Tobago
TTO
true
2
1
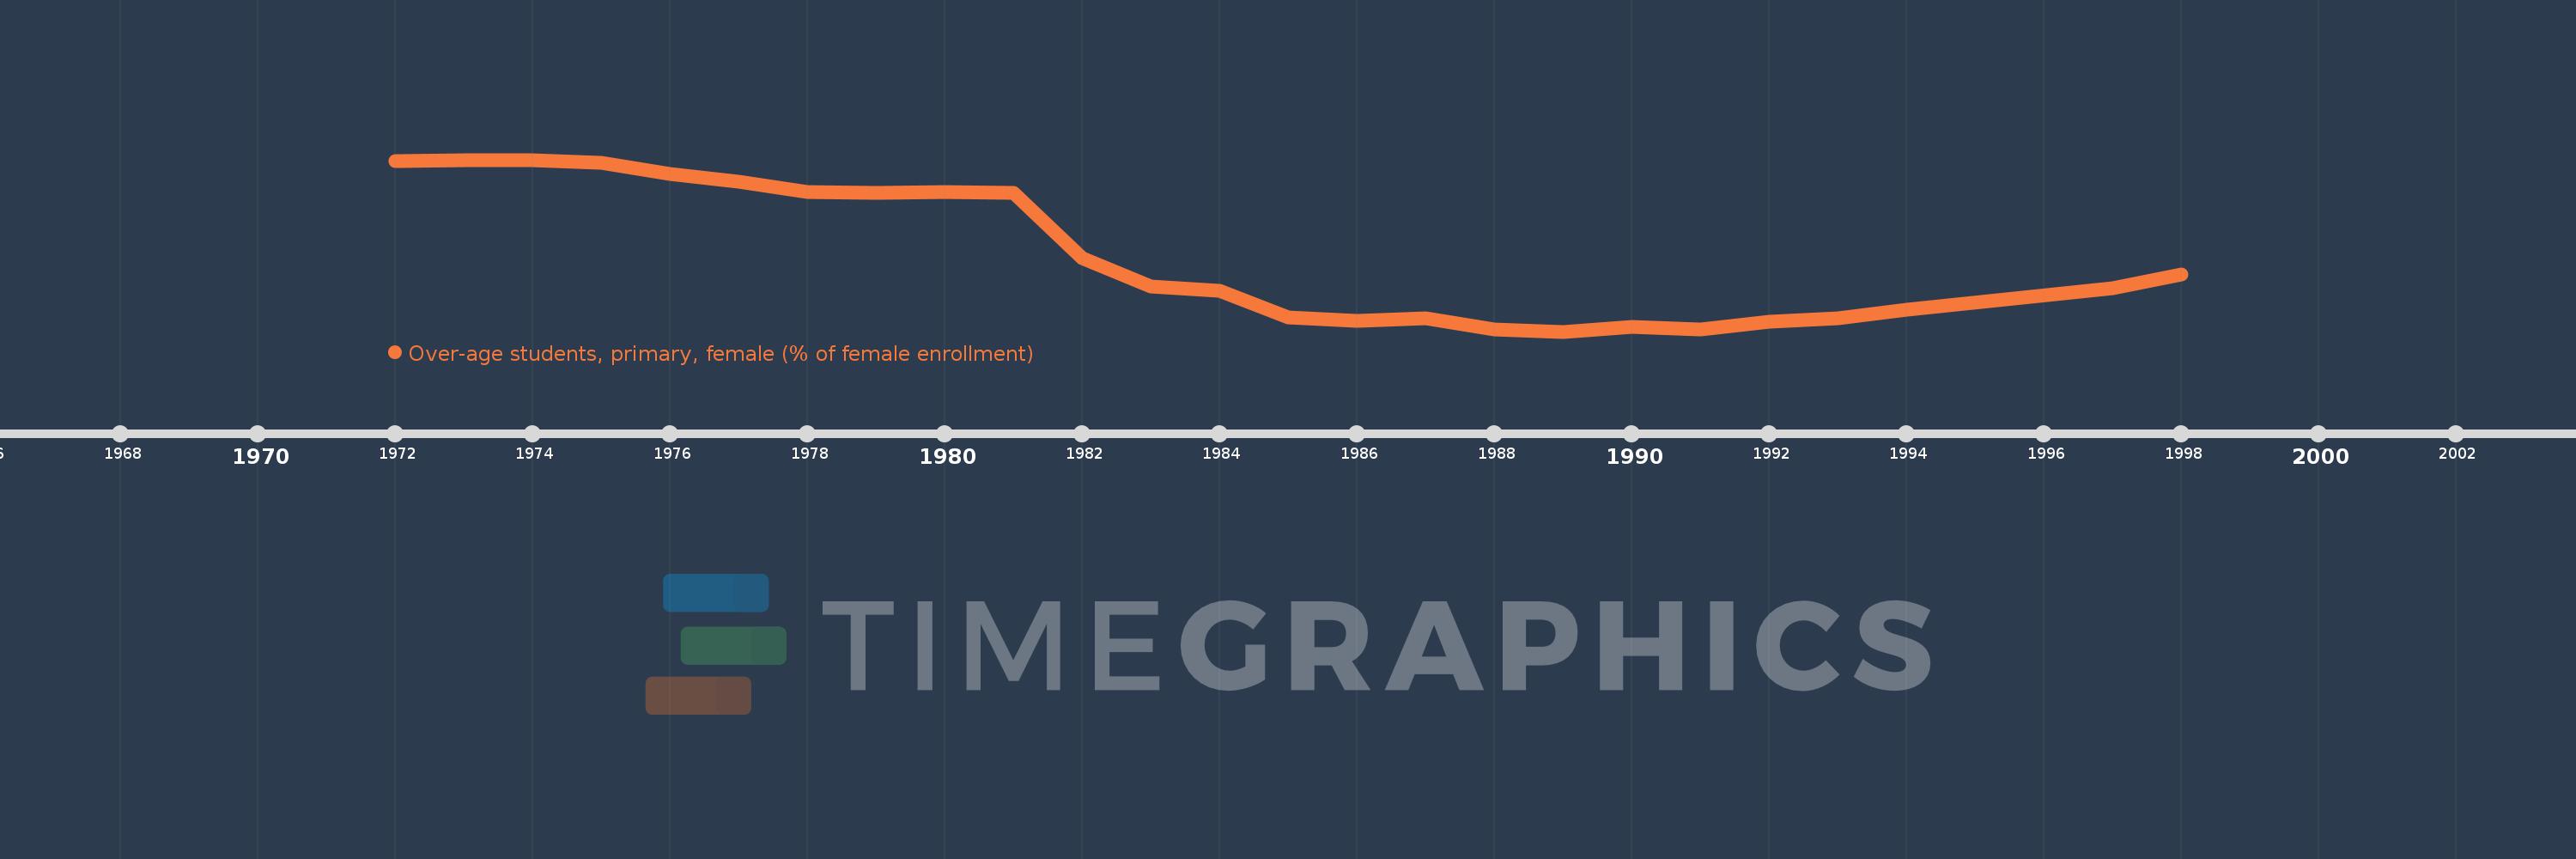
Over-age students, primary, female (% of female enrollment)
1998,1997,1994,1993,1992,1991,1990,1989,1988,1987,1986,1985,1984,1983,1982,1981,1980,1979,1978,1977,1976,1975,1974,1973,1972
This statistics in other country:
AfghanistanAlbaniaAlgeriaAndorraAngolaAntigua and BarbudaArgentinaArubaAustraliaAustriaAzerbaijanBahamas, TheBahrainBangladeshBarbadosBelarusBelgiumBelizeBeninBermudaBhutanBoliviaBosnia and HerzegovinaBotswanaBritish Virgin IslandsBrunei DarussalamBulgariaBurkina FasoBurundiCabo VerdeCambodiaCameroonCanadaCentral African RepublicChadChileChinaColombiaComorosCongo, Dem. Rep.Congo, Rep.Costa RicaCote d'IvoireCubaCyprusDenmarkDjiboutiDominicaDominican RepublicEcuadorEgypt, Arab Rep.El SalvadorEquatorial GuineaEritreaEstoniaEthiopiaFijiFinlandFranceGabonGambia, TheGeorgiaGermanyGhanaGreeceGrenadaGuatemalaGuineaGuinea-BissauGuyanaHaitiHondurasHong Kong SAR, ChinaHungaryIcelandIndiaIndonesiaIran, Islamic Rep.IraqIrelandItalyJamaicaJapanJordanKazakhstanKenyaKiribatiKorea, Dem. People’s Rep.Korea, Rep.KuwaitKyrgyz RepublicLao PDRLebanonLesothoLibyaLuxembourgMacao SAR, ChinaMadagascarMalawiMalaysiaMaldivesMaliMaltaMarshall IslandsMauritaniaMauritiusMexicoMoldovaMongoliaMontenegroMoroccoMozambiqueMyanmarNamibiaNepalNetherlandsNew ZealandNicaraguaNigerNorwayOmanPakistanPalauPanamaParaguayPeruPhilippinesPolandPortugalPuerto RicoQatarRussian FederationRwandaSamoaSao Tome and PrincipeSaudi ArabiaSenegalSerbiaSeychellesSierra LeoneSingaporeSint Maarten (Dutch part)SloveniaSolomon IslandsSomaliaSouth AfricaSouth SudanSpainSri LankaSt. Kitts and NevisSt. LuciaSt. Vincent and the GrenadinesSurinameSwazilandSwedenSwitzerlandSyrian Arab RepublicTajikistanTanzaniaThailandTimor-LesteTogoTongaTrinidad and TobagoTunisiaTurkeyTurks and Caicos IslandsTuvaluUgandaUkraineUnited Arab EmiratesUnited KingdomUnited StatesUruguayVanuatuVenezuela, RBVietnamZambiaZimbabwe Timeline:
This timeline shows a graph from 1972 to 1998 of Trinidad and Tobago. No data until 1971. Number of actual observations by date: 25.
Source name:
World Development Indicators
Source organization:
United Nations Educational, Scientific, and Cultural Organization (UNESCO) Institute for Statistics.
Categories, topics:
Education
Last updated:
apr 23, 2017
Indicators value changes by year
Maximum:
18.067
jan 1, 1973
At the date of observation
Value
Absolute change
Change from previous value
jan 1, 1972
17.931
+17.931
0.0%
jan 1, 1973
18.067
+0.136
0.76%
jan 1, 1974
18.066
-0.001
-0.01%
jan 1, 1975
17.835
-0.231
-1.28%
jan 1, 1976
16.862
-0.973
-5.46%
jan 1, 1977
16.217
-0.645
-3.83%
jan 1, 1978
15.318
-0.898
-5.54%
jan 1, 1979
15.305
-0.014
-0.09%
jan 1, 1980
15.321
+0.017
0.11%
jan 1, 1981
15.306
-0.015
-0.1%
jan 1, 1982
9.728
-5.578
-36.45%
jan 1, 1983
7.367
-2.361
-24.27%
jan 1, 1984
7.001
-0.366
-4.96%
jan 1, 1985
4.731
-2.27
-32.43%
jan 1, 1986
4.465
-0.266
-5.62%
jan 1, 1987
4.671
+0.206
4.62%
jan 1, 1988
3.75
-0.921
-19.71%
jan 1, 1989
3.546
-0.204
-5.45%
jan 1, 1990
3.921
+0.375
10.56%
jan 1, 1991
3.702
-0.219
-5.58%
jan 1, 1992
4.413
+0.711
19.2%
jan 1, 1993
4.701
+0.288
6.53%
jan 1, 1994
5.4
+0.699
14.88%
jan 1, 1997
7.186
+1.786
33.07%
jan 1, 1998
8.375
+1.189
16.54%
Ranking of countries by current statistics by years


Comments: