29
/
en
AIzaSyAYiBZKx7MnpbEhh9jyipgxe19OcubqV5w
April 1, 2024
214604
Norway
NOR
true
2
1
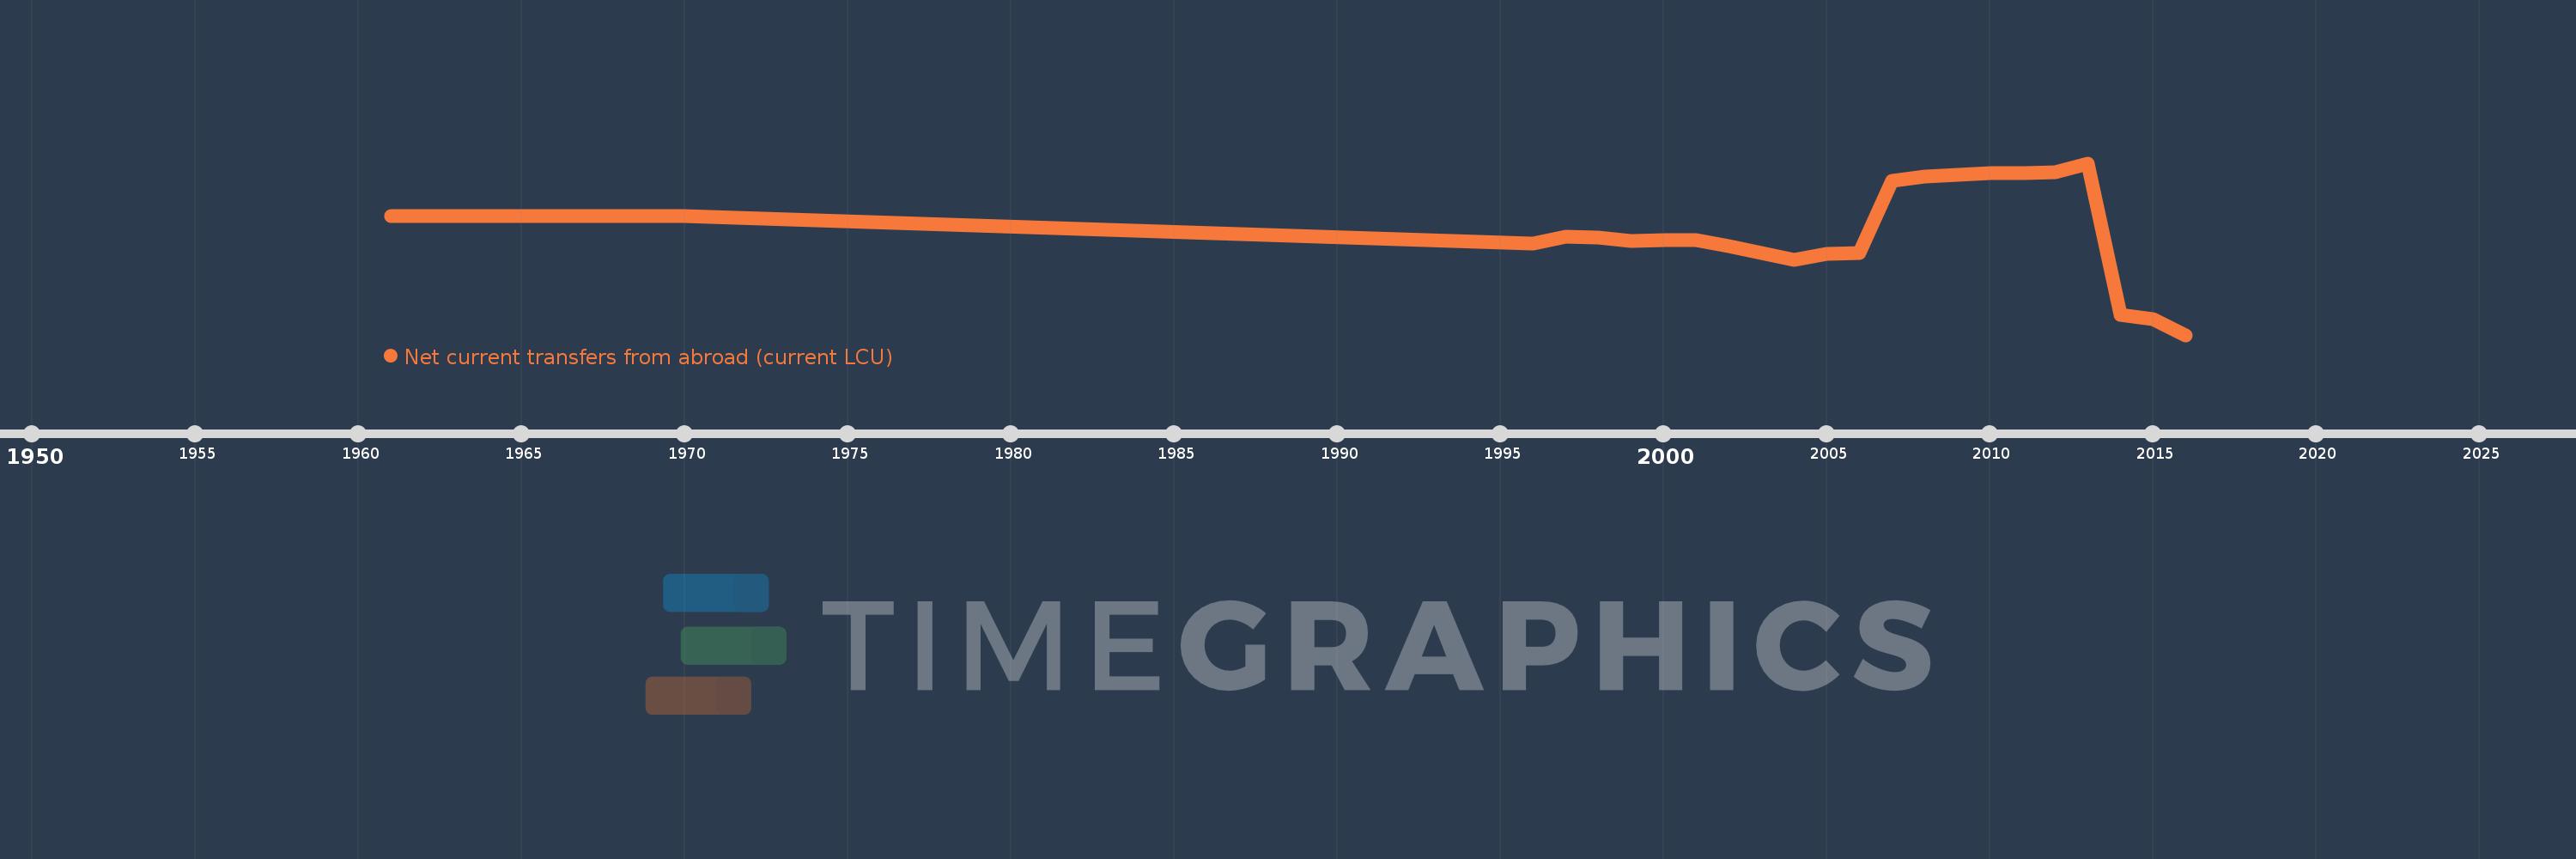
Net current transfers from abroad (current LCU)
2016,2015,2014,2013,2012,2011,2010,2009,2008,2007,2006,2005,2004,2003,2002,2001,2000,1999,1998,1997,1996,1970,1969,1968,1967,1966,1965,1964,1963,1962,1961
This statistics in other country:
AfghanistanAlbaniaAlgeriaAngolaAntigua and BarbudaArgentinaArmeniaAustraliaAustriaAzerbaijanBahamas, TheBangladeshBarbadosBelarusBelgiumBelizeBeninBermudaBhutanBoliviaBosnia and HerzegovinaBotswanaBrazilBrunei DarussalamBulgariaBurkina FasoBurundiCabo VerdeCambodiaCameroonCanadaCentral African RepublicChadChileChinaColombiaComorosCongo, Dem. Rep.Congo, Rep.Costa RicaCote d'IvoireCroatiaCzech RepublicDenmarkDjiboutiDominicaDominican RepublicEcuadorEgypt, Arab Rep.El SalvadorEquatorial GuineaEritreaEstoniaEthiopiaFaroe IslandsFijiFinlandFranceFrench PolynesiaGabonGambia, TheGeorgiaGermanyGhanaGreeceGrenadaGuatemalaGuineaGuinea-BissauGuyanaHaitiHondurasHong Kong SAR, ChinaHungaryIcelandIndiaIndonesiaIran, Islamic Rep.IraqIrelandIsraelItalyJamaicaJapanJordanKazakhstanKenyaKiribatiKorea, Rep.KosovoKyrgyz RepublicLao PDRLatviaLebanonLesothoLiberiaLibyaLithuaniaMacedonia, FYRMadagascarMalawiMalaysiaMaldivesMaliMauritaniaMauritiusMexicoMoldovaMongoliaMontenegroMoroccoMozambiqueMyanmarNamibiaNepalNetherlandsNew ZealandNicaraguaNigerNigeriaNorwayPakistanPalauPanamaPapua New GuineaParaguayPeruPhilippinesPolandPortugalRomaniaRussian FederationRwandaSamoaSao Tome and PrincipeSenegalSerbiaSeychellesSierra LeoneSingaporeSlovak RepublicSloveniaSolomon IslandsSouth AfricaSouth SudanSpainSri LankaSt. Kitts and NevisSt. LuciaSt. Vincent and the GrenadinesSudanSurinameSwazilandSwedenSwitzerlandSyrian Arab RepublicTajikistanTanzaniaThailandTimor-LesteTogoTongaTrinidad and TobagoTunisiaTurkeyTurkmenistanUgandaUkraineUnited KingdomUnited StatesUruguayUzbekistanVanuatuVenezuela, RBVietnamWest Bank and GazaYemen, Rep.ZambiaZimbabwe Timeline:
This timeline shows a graph from 1961 to 2016 of Norway. No data until 1960. Number of actual observations by date: 31.
Source name:
World Development Indicators
Source organization:
World Bank national accounts data, and OECD National Accounts data files.
Categories, topics:
Economy & Growth
Last updated:
apr 23, 2017
Indicators value changes by year
Minimum:
-56.164 bln
jan 1, 2016
Maximum:
25.117 bln
jan 1, 2013
At the date of observation
Value
Absolute change
Change from previous value
jan 1, 1961
192.283 mln
+192.283 mln
0.0%
jan 1, 1962
153.369 mln
-38.914 mln
-20.24%
jan 1, 1963
131.622 mln
-21.746 mln
-14.18%
jan 1, 1964
105.298 mln
-26.325 mln
-20.0%
jan 1, 1965
82.407 mln
-22.891 mln
-21.74%
jan 1, 1966
77.829 mln
-4.578 mln
-5.56%
jan 1, 1967
68.25 mln
-9.579 mln
-12.31%
jan 1, 1968
73.039 mln
+4.789 mln
7.02%
jan 1, 1969
74.237 mln
+1.197 mln
1.64%
jan 1, 1970
-38.316 mln
-112.553 mln
-151.61%
jan 1, 1996
-13.025 bln
-12.987 bln
33.89K%
jan 1, 1997
-9.711 bln
+3.314 bln
-25.44%
jan 1, 1998
-9.868 bln
-157.0 mln
1.62%
jan 1, 1999
-11.59 bln
-1.722 bln
17.45%
jan 1, 2000
-11.195 bln
+395.0 mln
-3.41%
jan 1, 2001
-11.062 bln
+133.0 mln
-1.19%
jan 1, 2002
-14.219 bln
-3.157 bln
28.54%
jan 1, 2003
-17.427 bln
-3.208 bln
22.56%
jan 1, 2004
-20.594 bln
-3.167 bln
18.17%
jan 1, 2005
-17.625 bln
+2.969 bln
-14.42%
jan 1, 2006
-17.157 bln
+468.0 mln
-2.66%
jan 1, 2007
16.963 bln
+34.12 bln
-198.87%
jan 1, 2008
18.931 bln
+1.968 bln
11.6%
jan 1, 2009
19.693 bln
+762.0 mln
4.03%
jan 1, 2010
20.245 bln
+552.0 mln
2.8%
jan 1, 2011
20.27 bln
+25.0 mln
0.12%
jan 1, 2012
21.033 bln
+763.0 mln
3.76%
jan 1, 2013
25.117 bln
+4.084 bln
19.42%
jan 1, 2014
-46.703 bln
-71.82 bln
-285.94%
jan 1, 2015
-48.815 bln
-2.112 bln
4.52%
jan 1, 2016
-56.164 bln
-7.349 bln
15.05%
Ranking of countries by current statistics by years


Comments: