29
/
en
AIzaSyAYiBZKx7MnpbEhh9jyipgxe19OcubqV5w
April 1, 2024
176751
Lebanon
LBN
true
2
1
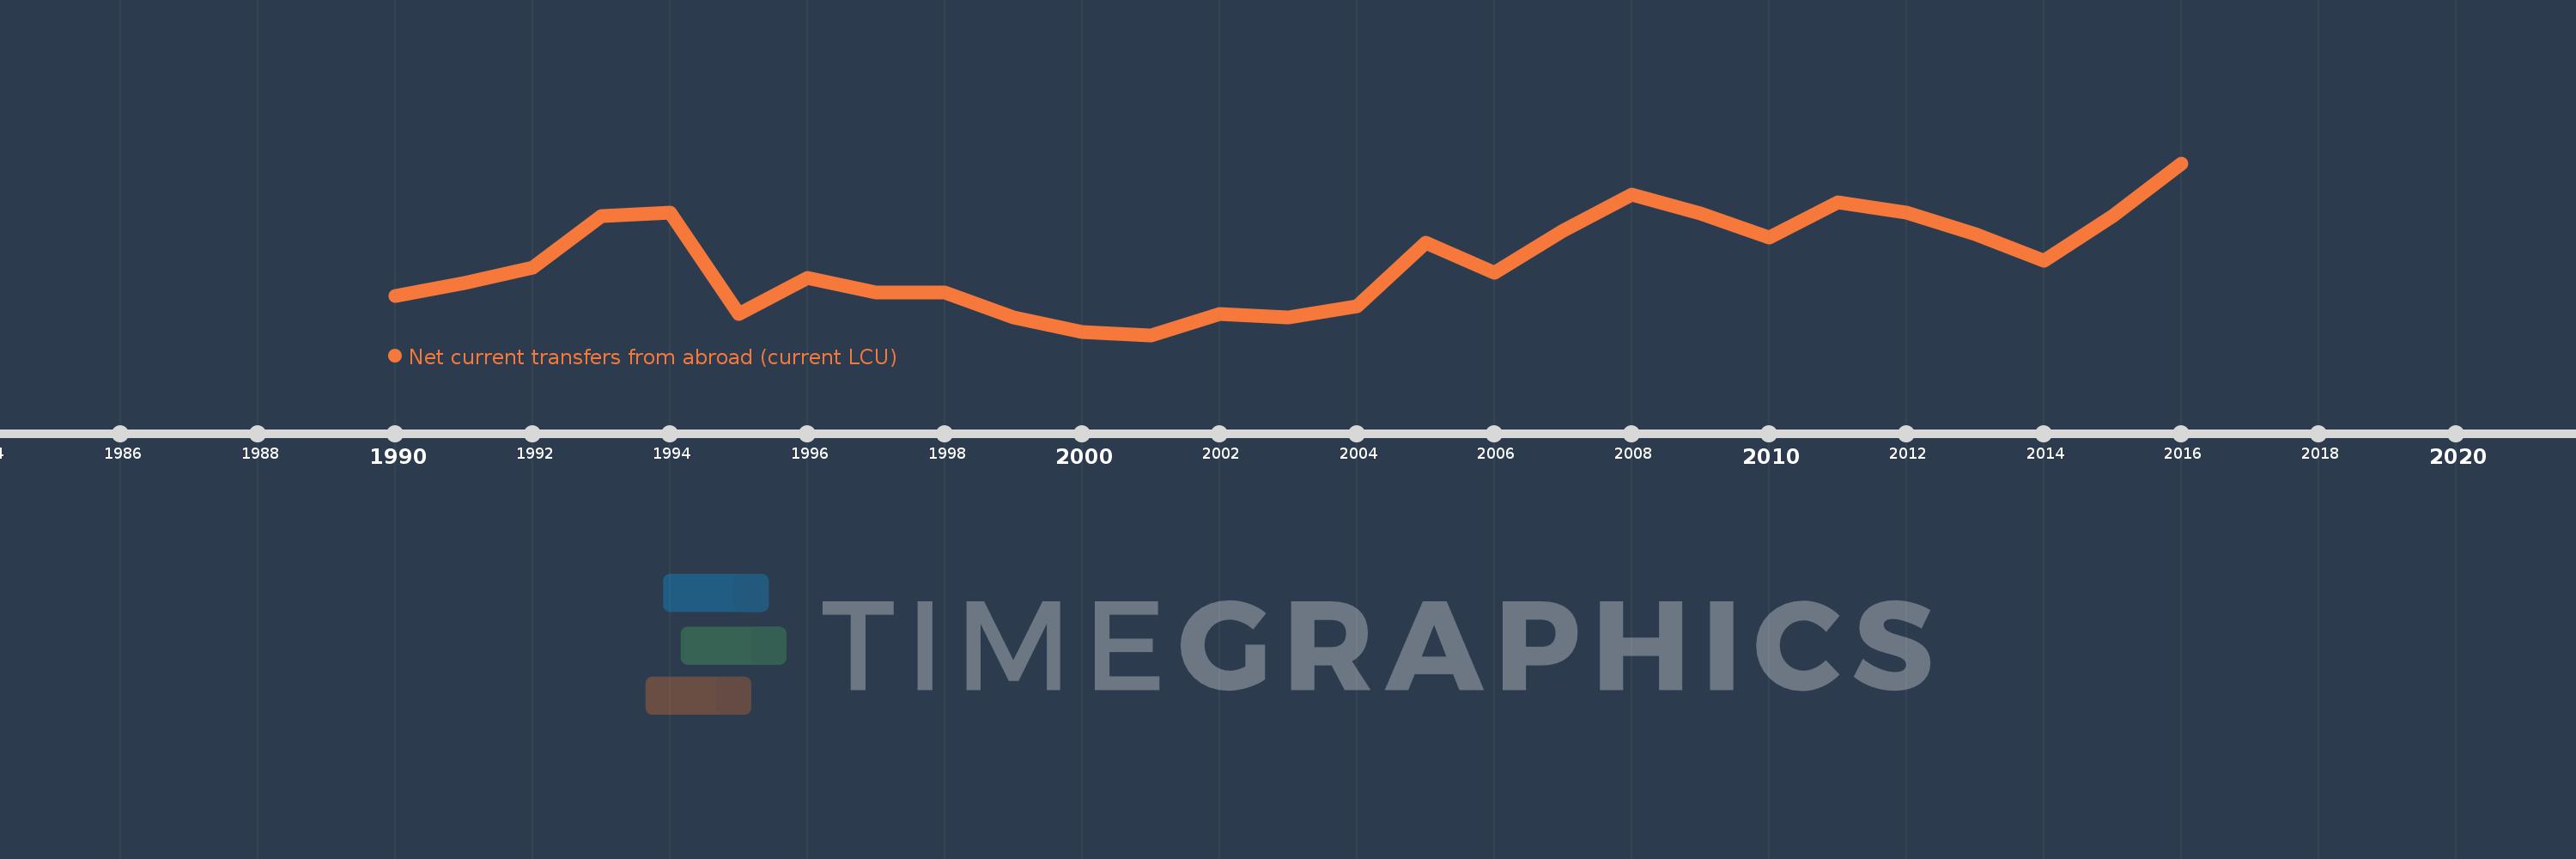
Net current transfers from abroad (current LCU)
2016,2015,2014,2013,2012,2011,2010,2009,2008,2007,2006,2005,2004,2003,2002,2001,2000,1999,1998,1997,1996,1995,1994,1993,1992,1991,1990
This statistics in other country:
AfghanistanAlbaniaAlgeriaAngolaAntigua and BarbudaArgentinaArmeniaAustraliaAustriaAzerbaijanBahamas, TheBangladeshBarbadosBelarusBelgiumBelizeBeninBermudaBhutanBoliviaBosnia and HerzegovinaBotswanaBrazilBrunei DarussalamBulgariaBurkina FasoBurundiCabo VerdeCambodiaCameroonCanadaCentral African RepublicChadChileChinaColombiaComorosCongo, Dem. Rep.Congo, Rep.Costa RicaCote d'IvoireCroatiaCzech RepublicDenmarkDjiboutiDominicaDominican RepublicEcuadorEgypt, Arab Rep.El SalvadorEquatorial GuineaEritreaEstoniaEthiopiaFaroe IslandsFijiFinlandFranceFrench PolynesiaGabonGambia, TheGeorgiaGermanyGhanaGreeceGrenadaGuatemalaGuineaGuinea-BissauGuyanaHaitiHondurasHong Kong SAR, ChinaHungaryIcelandIndiaIndonesiaIran, Islamic Rep.IraqIrelandIsraelItalyJamaicaJapanJordanKazakhstanKenyaKiribatiKorea, Rep.KosovoKyrgyz RepublicLao PDRLatviaLebanonLesothoLiberiaLibyaLithuaniaMacedonia, FYRMadagascarMalawiMalaysiaMaldivesMaliMauritaniaMauritiusMexicoMoldovaMongoliaMontenegroMoroccoMozambiqueMyanmarNamibiaNepalNetherlandsNew ZealandNicaraguaNigerNigeriaNorwayPakistanPalauPanamaPapua New GuineaParaguayPeruPhilippinesPolandPortugalRomaniaRussian FederationRwandaSamoaSao Tome and PrincipeSenegalSerbiaSeychellesSierra LeoneSingaporeSlovak RepublicSloveniaSolomon IslandsSouth AfricaSouth SudanSpainSri LankaSt. Kitts and NevisSt. LuciaSt. Vincent and the GrenadinesSudanSurinameSwazilandSwedenSwitzerlandSyrian Arab RepublicTajikistanTanzaniaThailandTimor-LesteTogoTongaTrinidad and TobagoTunisiaTurkeyTurkmenistanUgandaUkraineUnited KingdomUnited StatesUruguayUzbekistanVanuatuVenezuela, RBVietnamWest Bank and GazaYemen, Rep.ZambiaZimbabwe Timeline:
This timeline shows a graph from 1990 to 2016 of Lebanon. No data until 1989. Number of actual observations by date: 27.
Source name:
World Development Indicators
Source organization:
World Bank national accounts data, and OECD National Accounts data files.
Categories, topics:
Economy & Growth
Last updated:
apr 23, 2017
Indicators value changes by year
Minimum:
-453.757 bln
jan 1, 2001
Maximum:
5.202 trl
jan 1, 2016
At the date of observation
Value
Absolute change
Change from previous value
jan 1, 1990
820.631 bln
+820.631 bln
0.0%
jan 1, 1991
1.263 trl
+442.693 bln
53.95%
jan 1, 1992
1.759 trl
+495.838 bln
39.25%
jan 1, 1993
3.453 trl
+1.694 trl
96.29%
jan 1, 1994
3.569 trl
+115.92 bln
3.36%
jan 1, 1995
234.562 bln
-3.334 trl
-93.43%
jan 1, 1996
1.428 trl
+1.194 trl
508.99%
jan 1, 1997
945.706 bln
-482.748 bln
-33.8%
jan 1, 1998
951.244 bln
+5.538 bln
0.59%
jan 1, 1999
137.944 bln
-813.3 bln
-85.5%
jan 1, 2000
-342.28 bln
-480.224 bln
-348.13%
jan 1, 2001
-453.757 bln
-111.478 bln
32.57%
jan 1, 2002
227.632 bln
+681.39 bln
-150.17%
jan 1, 2003
116.982 bln
-110.65 bln
-48.61%
jan 1, 2004
495.214 bln
+378.232 bln
323.32%
jan 1, 2005
2.587 trl
+2.092 trl
422.34%
jan 1, 2006
1.602 trl
-984.699 bln
-38.07%
jan 1, 2007
2.968 trl
+1.366 trl
85.28%
jan 1, 2008
4.174 trl
+1.206 trl
40.61%
jan 1, 2009
3.558 trl
-615.663 bln
-14.75%
jan 1, 2010
2.754 trl
-803.799 bln
-22.59%
jan 1, 2011
3.921 trl
+1.166 trl
42.34%
jan 1, 2012
3.564 trl
-356.675 bln
-9.1%
jan 1, 2013
2.867 trl
-696.616 bln
-19.55%
jan 1, 2014
1.98 trl
-887.164 bln
-30.94%
jan 1, 2015
3.458 trl
+1.478 trl
74.62%
jan 1, 2016
5.202 trl
+1.744 trl
50.44%
Ranking of countries by current statistics by years


Comments: