29
/
en
AIzaSyAYiBZKx7MnpbEhh9jyipgxe19OcubqV5w
April 1, 2024
120176
Djibouti
DJI
true
2
1
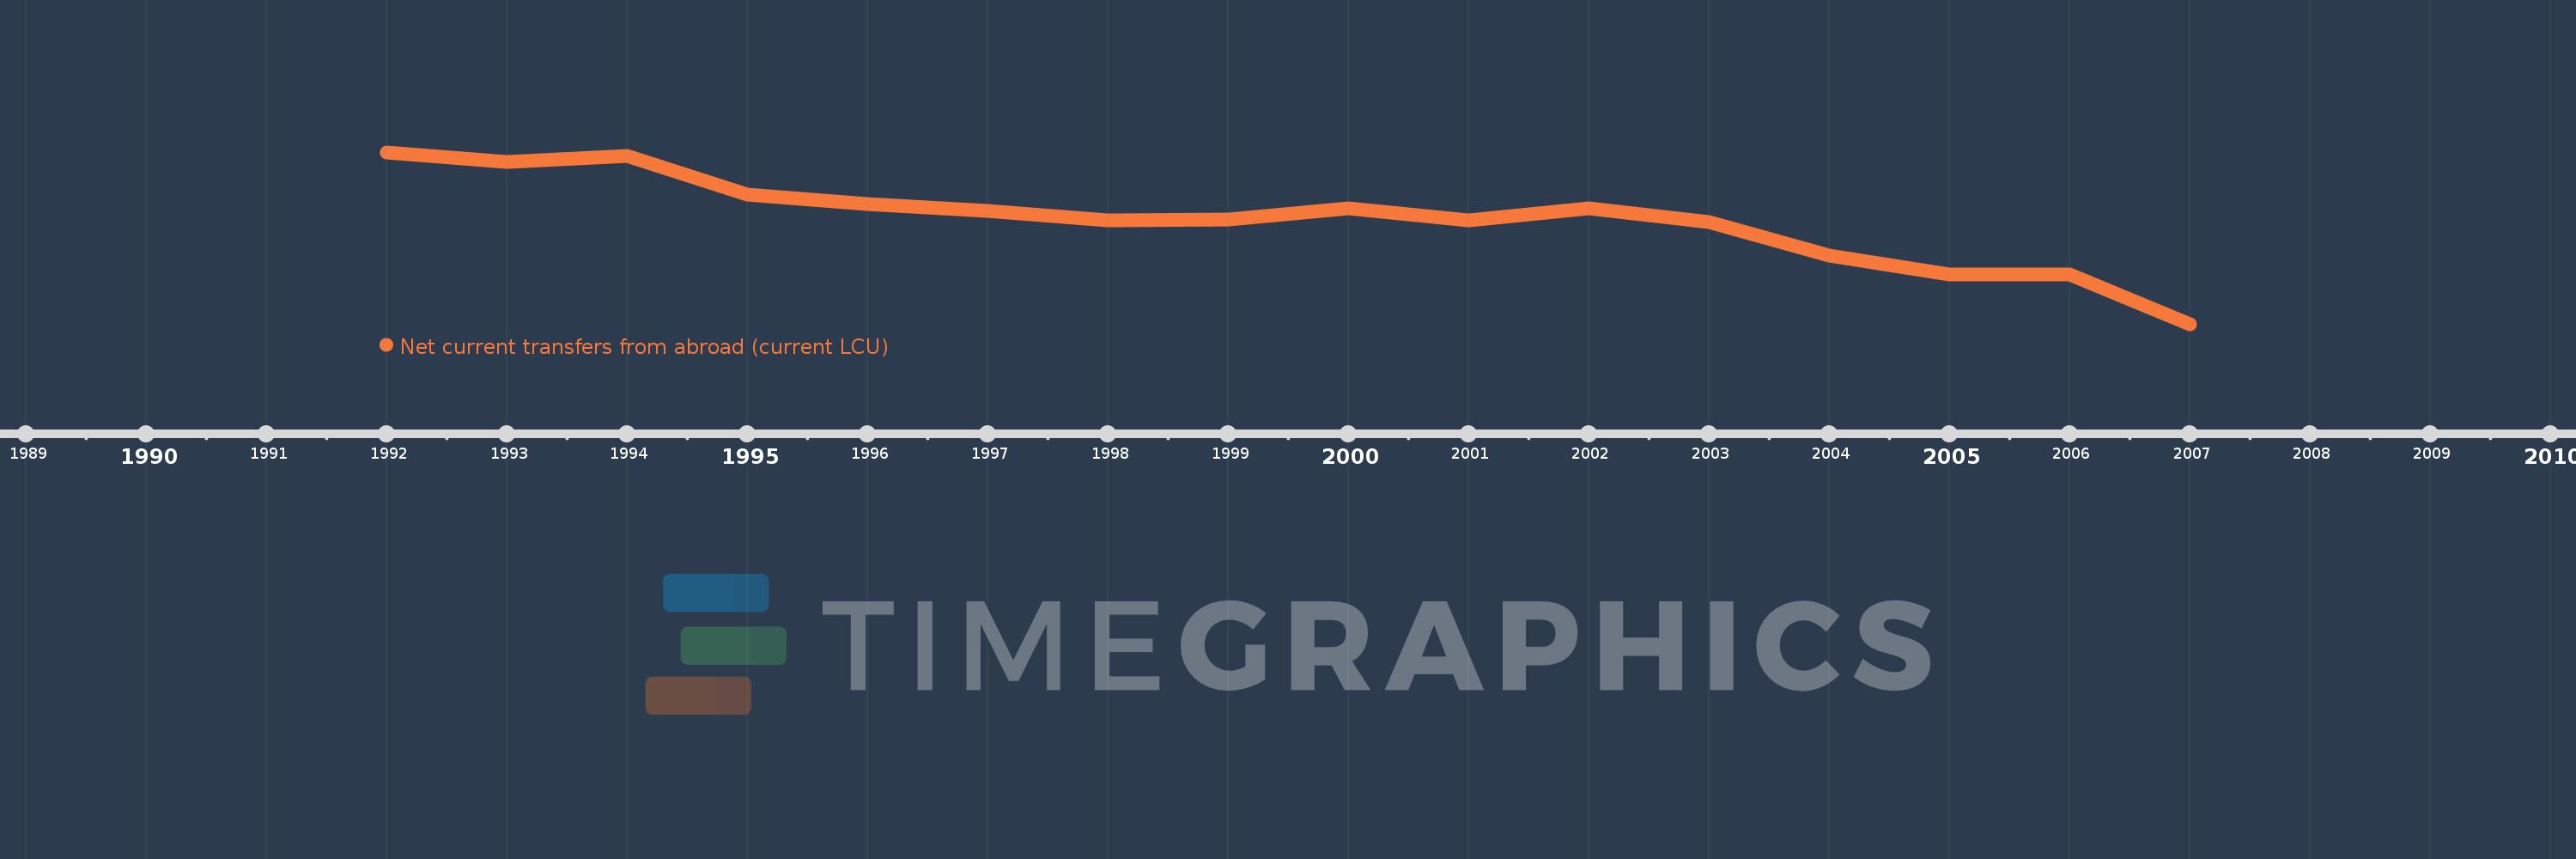
Net current transfers from abroad (current LCU)
2007,2006,2005,2004,2003,2002,2001,2000,1999,1998,1997,1996,1995,1994,1993,1992
This statistics in other country:
AfghanistanAlbaniaAlgeriaAngolaAntigua and BarbudaArgentinaArmeniaAustraliaAustriaAzerbaijanBahamas, TheBangladeshBarbadosBelarusBelgiumBelizeBeninBermudaBhutanBoliviaBosnia and HerzegovinaBotswanaBrazilBrunei DarussalamBulgariaBurkina FasoBurundiCabo VerdeCambodiaCameroonCanadaCentral African RepublicChadChileChinaColombiaComorosCongo, Dem. Rep.Congo, Rep.Costa RicaCote d'IvoireCroatiaCzech RepublicDenmarkDjiboutiDominicaDominican RepublicEcuadorEgypt, Arab Rep.El SalvadorEquatorial GuineaEritreaEstoniaEthiopiaFaroe IslandsFijiFinlandFranceFrench PolynesiaGabonGambia, TheGeorgiaGermanyGhanaGreeceGrenadaGuatemalaGuineaGuinea-BissauGuyanaHaitiHondurasHong Kong SAR, ChinaHungaryIcelandIndiaIndonesiaIran, Islamic Rep.IraqIrelandIsraelItalyJamaicaJapanJordanKazakhstanKenyaKiribatiKorea, Rep.KosovoKyrgyz RepublicLao PDRLatviaLebanonLesothoLiberiaLibyaLithuaniaMacedonia, FYRMadagascarMalawiMalaysiaMaldivesMaliMauritaniaMauritiusMexicoMoldovaMongoliaMontenegroMoroccoMozambiqueMyanmarNamibiaNepalNetherlandsNew ZealandNicaraguaNigerNigeriaNorwayPakistanPalauPanamaPapua New GuineaParaguayPeruPhilippinesPolandPortugalRomaniaRussian FederationRwandaSamoaSao Tome and PrincipeSenegalSerbiaSeychellesSierra LeoneSingaporeSlovak RepublicSloveniaSolomon IslandsSouth AfricaSouth SudanSpainSri LankaSt. Kitts and NevisSt. LuciaSt. Vincent and the GrenadinesSudanSurinameSwazilandSwedenSwitzerlandSyrian Arab RepublicTajikistanTanzaniaThailandTimor-LesteTogoTongaTrinidad and TobagoTunisiaTurkeyTurkmenistanUgandaUkraineUnited KingdomUnited StatesUruguayUzbekistanVanuatuVenezuela, RBVietnamWest Bank and GazaYemen, Rep.ZambiaZimbabwe Timeline:
This timeline shows a graph from 1992 to 2007 of Djibouti. No data until 1991. Number of actual observations by date: 16.
Source name:
World Development Indicators
Source organization:
World Bank national accounts data, and OECD National Accounts data files.
Categories, topics:
Economy & Growth
Last updated:
apr 23, 2017
Indicators value changes by year
Minimum:
-3.377 bln
jan 1, 2007
Maximum:
16.754 bln
jan 1, 1992
At the date of observation
Value
Absolute change
Change from previous value
jan 1, 1992
16.754 bln
+16.754 bln
0.0%
jan 1, 1993
15.673 bln
-1.081 bln
-6.45%
jan 1, 1994
16.297 bln
+624.0 mln
3.98%
jan 1, 1995
11.855 bln
-4.442 bln
-27.26%
jan 1, 1996
10.716 bln
-1.139 bln
-9.61%
jan 1, 1997
9.921 bln
-795.0 mln
-7.42%
jan 1, 1998
8.809 bln
-1.112 bln
-11.21%
jan 1, 1999
8.847 bln
+38.0 mln
0.43%
jan 1, 2000
10.212 bln
+1.365 bln
15.43%
jan 1, 2001
8.839 bln
-1.373 bln
-13.44%
jan 1, 2002
10.224 bln
+1.385 bln
15.67%
jan 1, 2003
8.548 bln
-1.676 bln
-16.39%
jan 1, 2004
4.621 bln
-3.928 bln
-45.95%
jan 1, 2005
2.488 bln
-2.133 bln
-46.15%
jan 1, 2006
2.488 bln
0.0
0.0%
jan 1, 2007
-3.377 bln
-5.865 bln
-235.71%
Ranking of countries by current statistics by years


Comments: