29
/
en
AIzaSyAYiBZKx7MnpbEhh9jyipgxe19OcubqV5w
April 1, 2024
125165
Egypt, Arab Rep.
EGY
true
2
1
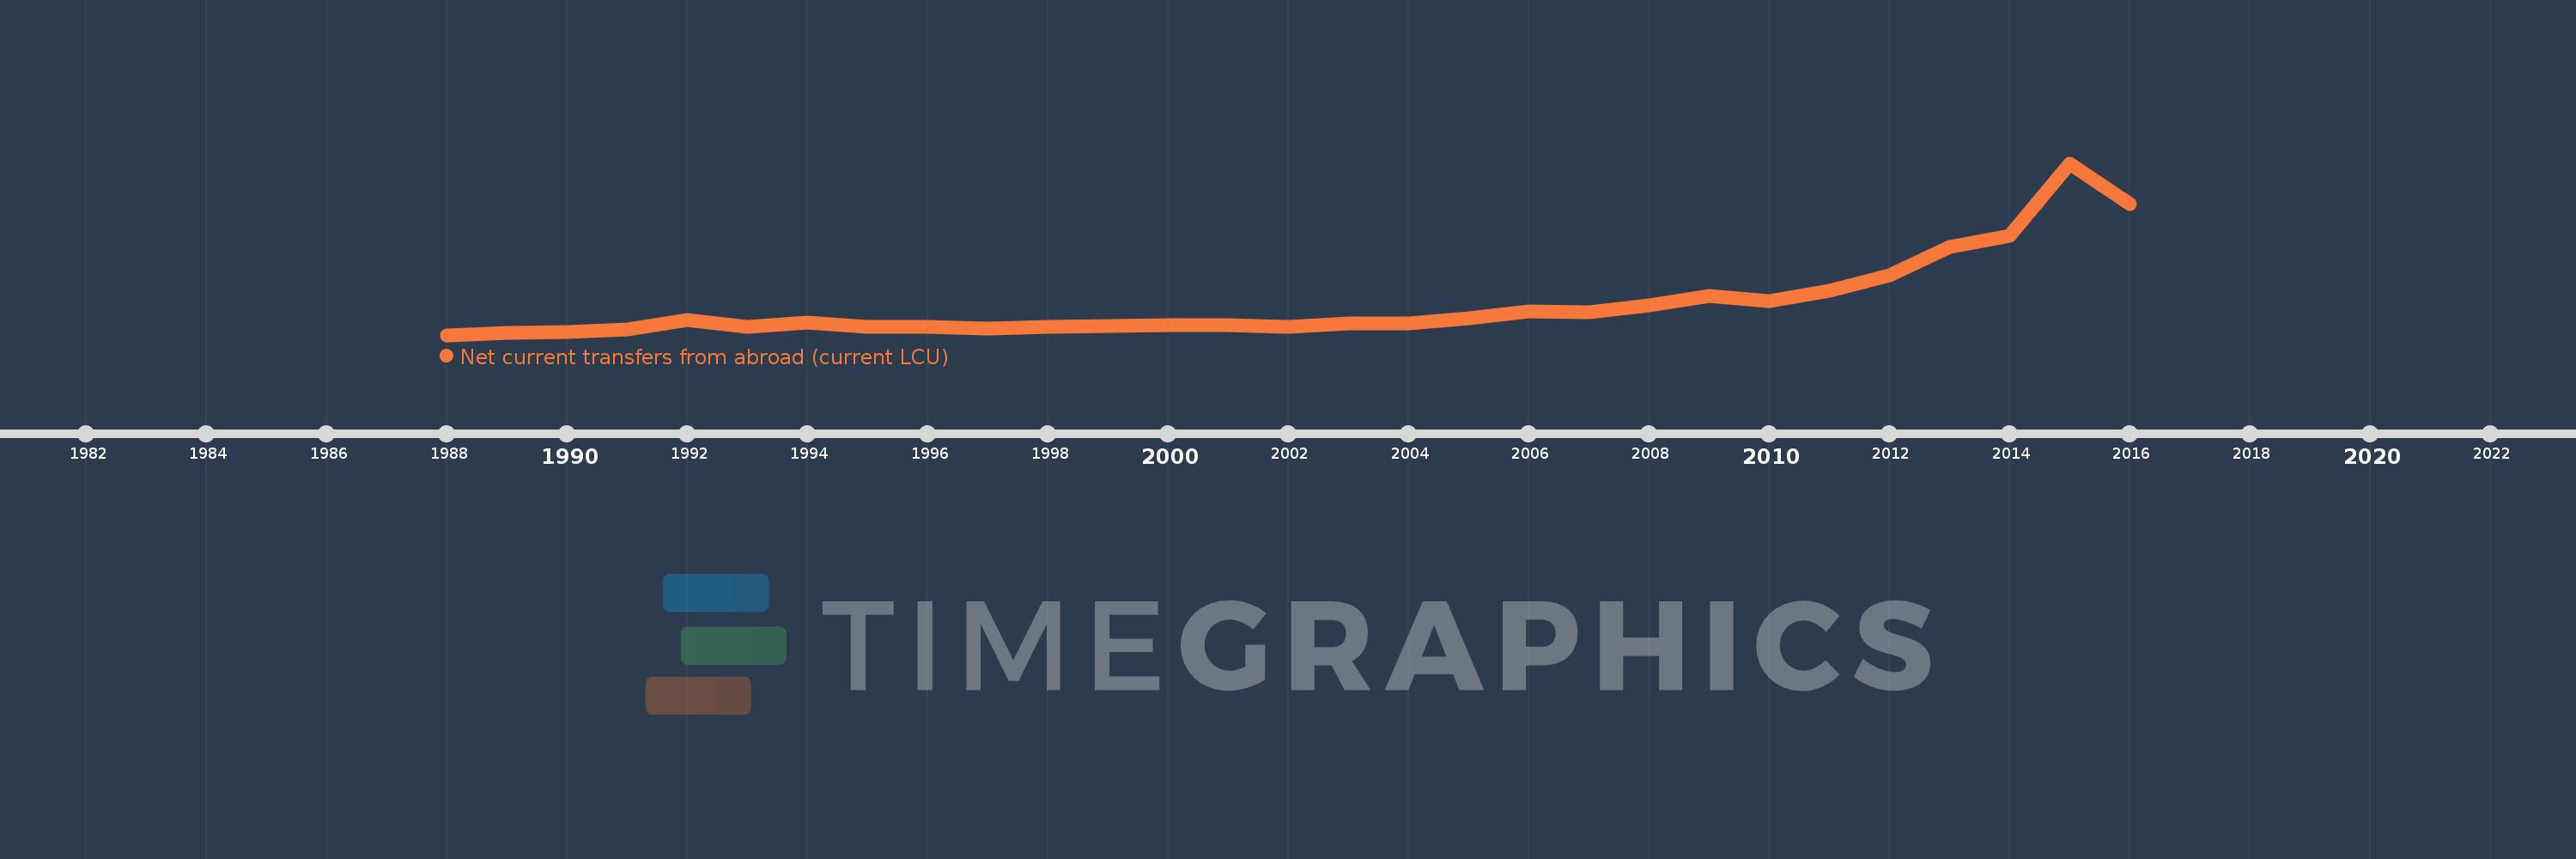
Net current transfers from abroad (current LCU)
2016,2015,2014,2013,2012,2011,2010,2009,2008,2007,2006,2005,2004,2003,2002,2001,2000,1999,1998,1997,1996,1995,1994,1993,1992,1991,1990,1989,1988
This statistics in other country:
AfghanistanAlbaniaAlgeriaAngolaAntigua and BarbudaArgentinaArmeniaAustraliaAustriaAzerbaijanBahamas, TheBangladeshBarbadosBelarusBelgiumBelizeBeninBermudaBhutanBoliviaBosnia and HerzegovinaBotswanaBrazilBrunei DarussalamBulgariaBurkina FasoBurundiCabo VerdeCambodiaCameroonCanadaCentral African RepublicChadChileChinaColombiaComorosCongo, Dem. Rep.Congo, Rep.Costa RicaCote d'IvoireCroatiaCzech RepublicDenmarkDjiboutiDominicaDominican RepublicEcuadorEgypt, Arab Rep.El SalvadorEquatorial GuineaEritreaEstoniaEthiopiaFaroe IslandsFijiFinlandFranceFrench PolynesiaGabonGambia, TheGeorgiaGermanyGhanaGreeceGrenadaGuatemalaGuineaGuinea-BissauGuyanaHaitiHondurasHong Kong SAR, ChinaHungaryIcelandIndiaIndonesiaIran, Islamic Rep.IraqIrelandIsraelItalyJamaicaJapanJordanKazakhstanKenyaKiribatiKorea, Rep.KosovoKyrgyz RepublicLao PDRLatviaLebanonLesothoLiberiaLibyaLithuaniaMacedonia, FYRMadagascarMalawiMalaysiaMaldivesMaliMauritaniaMauritiusMexicoMoldovaMongoliaMontenegroMoroccoMozambiqueMyanmarNamibiaNepalNetherlandsNew ZealandNicaraguaNigerNigeriaNorwayPakistanPalauPanamaPapua New GuineaParaguayPeruPhilippinesPolandPortugalRomaniaRussian FederationRwandaSamoaSao Tome and PrincipeSenegalSerbiaSeychellesSierra LeoneSingaporeSlovak RepublicSloveniaSolomon IslandsSouth AfricaSouth SudanSpainSri LankaSt. Kitts and NevisSt. LuciaSt. Vincent and the GrenadinesSudanSurinameSwazilandSwedenSwitzerlandSyrian Arab RepublicTajikistanTanzaniaThailandTimor-LesteTogoTongaTrinidad and TobagoTunisiaTurkeyTurkmenistanUgandaUkraineUnited KingdomUnited StatesUruguayUzbekistanVanuatuVenezuela, RBVietnamWest Bank and GazaYemen, Rep.ZambiaZimbabwe Timeline:
This timeline shows a graph from 1988 to 2016 of Egypt, Arab Rep.. No data until 1987. Number of actual observations by date: 29.
Source name:
World Development Indicators
Source organization:
World Bank national accounts data, and OECD National Accounts data files.
Categories, topics:
Economy & Growth
Last updated:
apr 23, 2017
Indicators value changes by year
Minimum:
4.273 bln
jan 1, 1988
Maximum:
211.711 bln
jan 1, 2015
At the date of observation
Value
Absolute change
Change from previous value
jan 1, 1988
4.273 bln
+4.273 bln
0.0%
jan 1, 1989
7.187 bln
+2.915 bln
68.21%
jan 1, 1990
8.219 bln
+1.031 bln
14.35%
jan 1, 1991
10.78 bln
+2.561 bln
31.17%
jan 1, 1992
22.326 bln
+11.545 bln
107.1%
jan 1, 1993
14.557 bln
-7.768 bln
-34.8%
jan 1, 1994
19.116 bln
+4.559 bln
31.32%
jan 1, 1995
13.643 bln
-5.473 bln
-28.63%
jan 1, 1996
14.234 bln
+590.949 mln
4.33%
jan 1, 1997
11.944 bln
-2.29 bln
-16.09%
jan 1, 1998
14.052 bln
+2.109 bln
17.66%
jan 1, 1999
15.586 bln
+1.534 bln
10.91%
jan 1, 2000
16.511 bln
+925.302 mln
5.94%
jan 1, 2001
15.94 bln
-570.742 mln
-3.46%
jan 1, 2002
13.749 bln
-2.192 bln
-13.75%
jan 1, 2003
18.328 bln
+4.579 bln
33.3%
jan 1, 2004
18.155 bln
-173.065 mln
-0.94%
jan 1, 2005
24.234 bln
+6.079 bln
33.49%
jan 1, 2006
32.567 bln
+8.333 bln
34.38%
jan 1, 2007
31.896 bln
-670.975 mln
-2.06%
jan 1, 2008
40.32 bln
+8.424 bln
26.41%
jan 1, 2009
51.357 bln
+11.037 bln
27.37%
jan 1, 2010
45.481 bln
-5.876 bln
-11.44%
jan 1, 2011
57.676 bln
+12.196 bln
26.82%
jan 1, 2012
76.322 bln
+18.646 bln
32.33%
jan 1, 2013
110.347 bln
+34.025 bln
44.58%
jan 1, 2014
124.194 bln
+13.847 bln
12.55%
jan 1, 2015
211.711 bln
+87.517 bln
70.47%
jan 1, 2016
162.32 bln
-49.391 bln
-23.33%
Ranking of countries by current statistics by years


Comments: