29
/
en
AIzaSyAYiBZKx7MnpbEhh9jyipgxe19OcubqV5w
April 1, 2024
128593
Eritrea
ERI
true
2
1
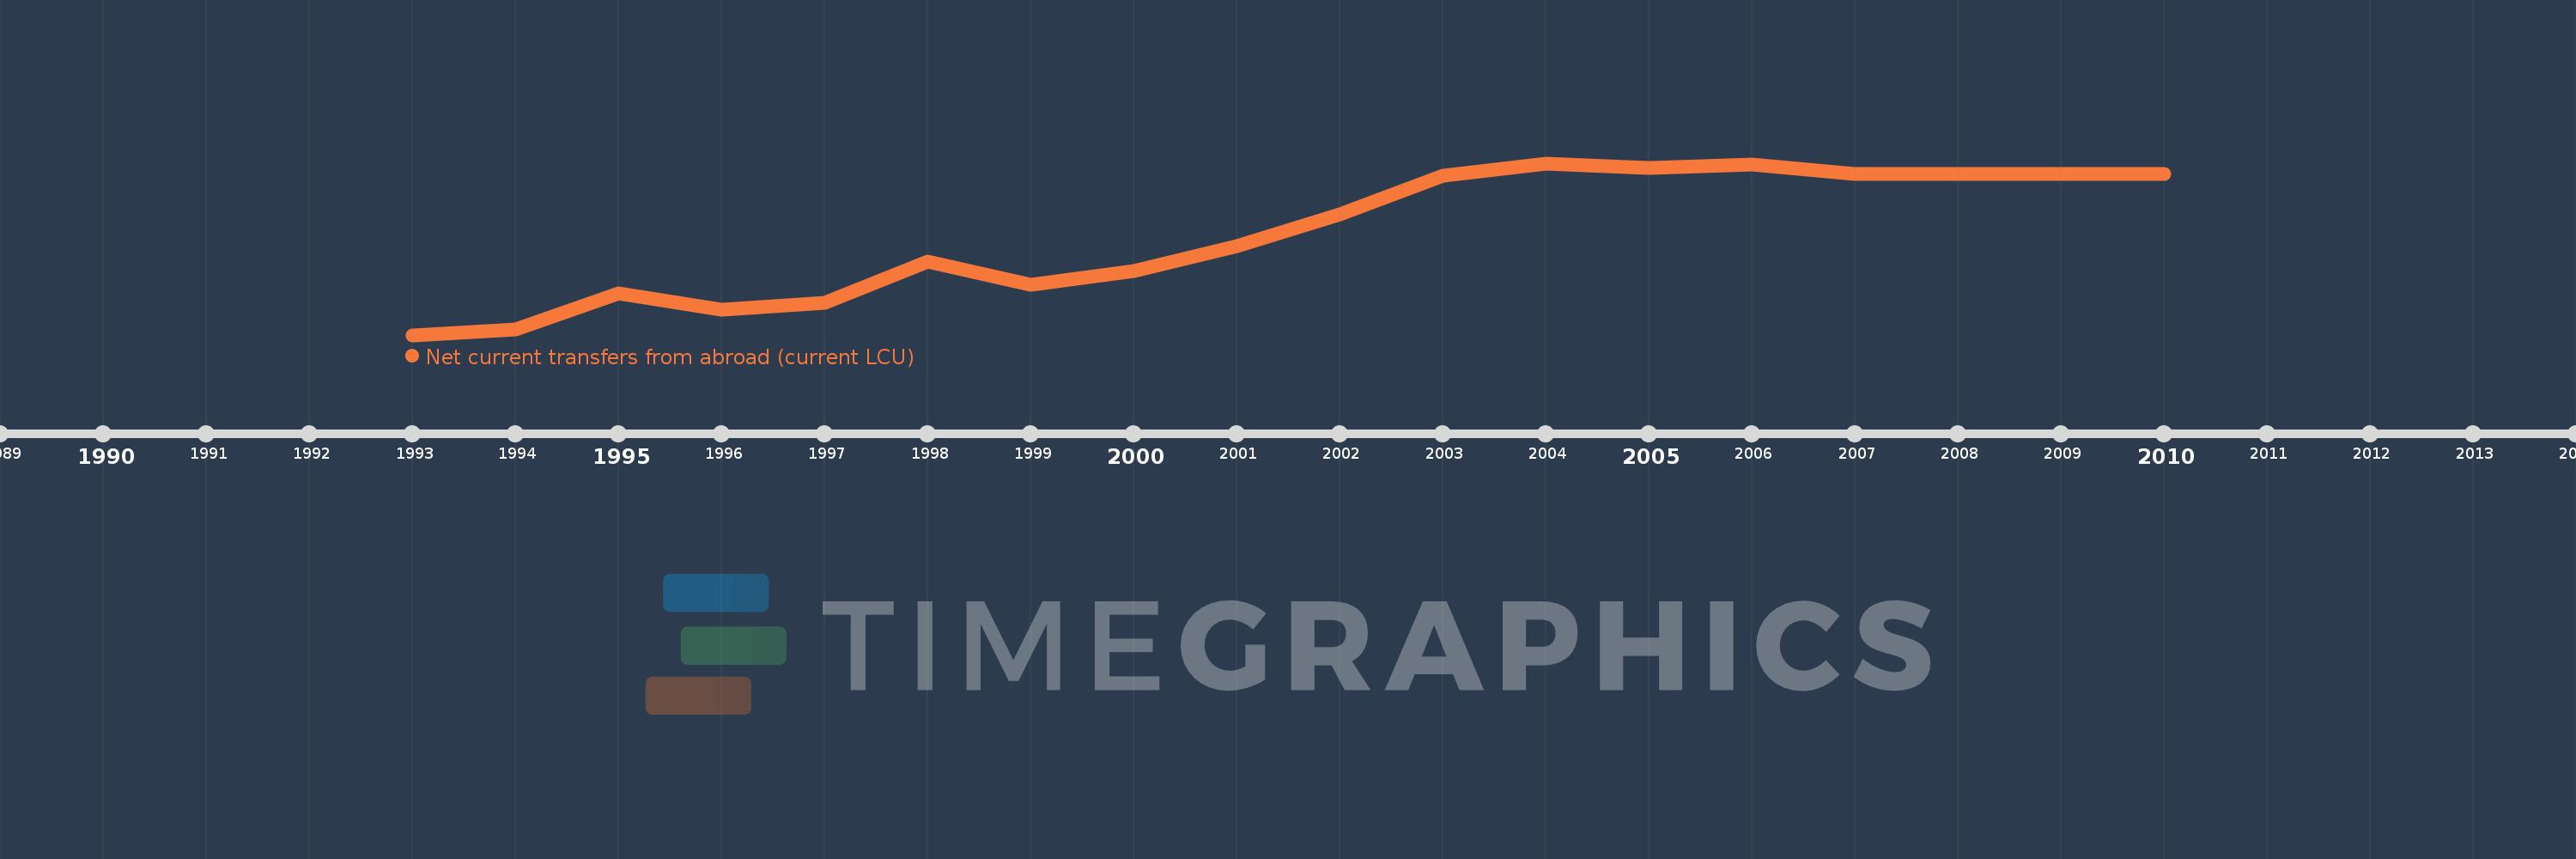
Net current transfers from abroad (current LCU)
2010,2009,2008,2007,2006,2005,2004,2003,2002,2001,2000,1999,1998,1997,1996,1995,1994,1993
This statistics in other country:
AfghanistanAlbaniaAlgeriaAngolaAntigua and BarbudaArgentinaArmeniaAustraliaAustriaAzerbaijanBahamas, TheBangladeshBarbadosBelarusBelgiumBelizeBeninBermudaBhutanBoliviaBosnia and HerzegovinaBotswanaBrazilBrunei DarussalamBulgariaBurkina FasoBurundiCabo VerdeCambodiaCameroonCanadaCentral African RepublicChadChileChinaColombiaComorosCongo, Dem. Rep.Congo, Rep.Costa RicaCote d'IvoireCroatiaCzech RepublicDenmarkDjiboutiDominicaDominican RepublicEcuadorEgypt, Arab Rep.El SalvadorEquatorial GuineaEritreaEstoniaEthiopiaFaroe IslandsFijiFinlandFranceFrench PolynesiaGabonGambia, TheGeorgiaGermanyGhanaGreeceGrenadaGuatemalaGuineaGuinea-BissauGuyanaHaitiHondurasHong Kong SAR, ChinaHungaryIcelandIndiaIndonesiaIran, Islamic Rep.IraqIrelandIsraelItalyJamaicaJapanJordanKazakhstanKenyaKiribatiKorea, Rep.KosovoKyrgyz RepublicLao PDRLatviaLebanonLesothoLiberiaLibyaLithuaniaMacedonia, FYRMadagascarMalawiMalaysiaMaldivesMaliMauritaniaMauritiusMexicoMoldovaMongoliaMontenegroMoroccoMozambiqueMyanmarNamibiaNepalNetherlandsNew ZealandNicaraguaNigerNigeriaNorwayPakistanPalauPanamaPapua New GuineaParaguayPeruPhilippinesPolandPortugalRomaniaRussian FederationRwandaSamoaSao Tome and PrincipeSenegalSerbiaSeychellesSierra LeoneSingaporeSlovak RepublicSloveniaSolomon IslandsSouth AfricaSouth SudanSpainSri LankaSt. Kitts and NevisSt. LuciaSt. Vincent and the GrenadinesSudanSurinameSwazilandSwedenSwitzerlandSyrian Arab RepublicTajikistanTanzaniaThailandTimor-LesteTogoTongaTrinidad and TobagoTunisiaTurkeyTurkmenistanUgandaUkraineUnited KingdomUnited StatesUruguayUzbekistanVanuatuVenezuela, RBVietnamWest Bank and GazaYemen, Rep.ZambiaZimbabwe Timeline:
This timeline shows a graph from 1993 to 2010 of Eritrea. No data until 1992. Number of actual observations by date: 18.
Source name:
World Development Indicators
Source organization:
World Bank national accounts data, and OECD National Accounts data files.
Categories, topics:
Economy & Growth
Last updated:
apr 23, 2017
Indicators value changes by year
Minimum:
782.369 mln
jan 1, 1993
Maximum:
5.732 bln
jan 1, 2004
At the date of observation
Value
Absolute change
Change from previous value
jan 1, 1993
782.369 mln
+782.369 mln
0.0%
jan 1, 1994
955.367 mln
+172.998 mln
22.11%
jan 1, 1995
1.972 bln
+1.016 bln
106.39%
jan 1, 1996
1.519 bln
-452.456 mln
-22.95%
jan 1, 1997
1.721 bln
+202.034 mln
13.3%
jan 1, 1998
2.905 bln
+1.184 bln
68.77%
jan 1, 1999
2.239 bln
-666.431 mln
-22.94%
jan 1, 2000
2.617 bln
+378.511 mln
16.91%
jan 1, 2001
3.354 bln
+737.091 mln
28.16%
jan 1, 2002
4.257 bln
+902.583 mln
26.91%
jan 1, 2003
5.363 bln
+1.106 bln
25.98%
jan 1, 2004
5.732 bln
+368.832 mln
6.88%
jan 1, 2005
5.588 bln
-143.499 mln
-2.5%
jan 1, 2006
5.698 bln
+110.344 mln
1.97%
jan 1, 2007
5.427 bln
-271.042 mln
-4.76%
jan 1, 2008
5.427 bln
0.0
0.0%
jan 1, 2009
5.427 bln
0.0
0.0%
jan 1, 2010
5.427 bln
0.0
0.0%
Ranking of countries by current statistics by years


Comments: