29
/
en
AIzaSyAYiBZKx7MnpbEhh9jyipgxe19OcubqV5w
April 1, 2024
212055
Niger
NER
true
2
1
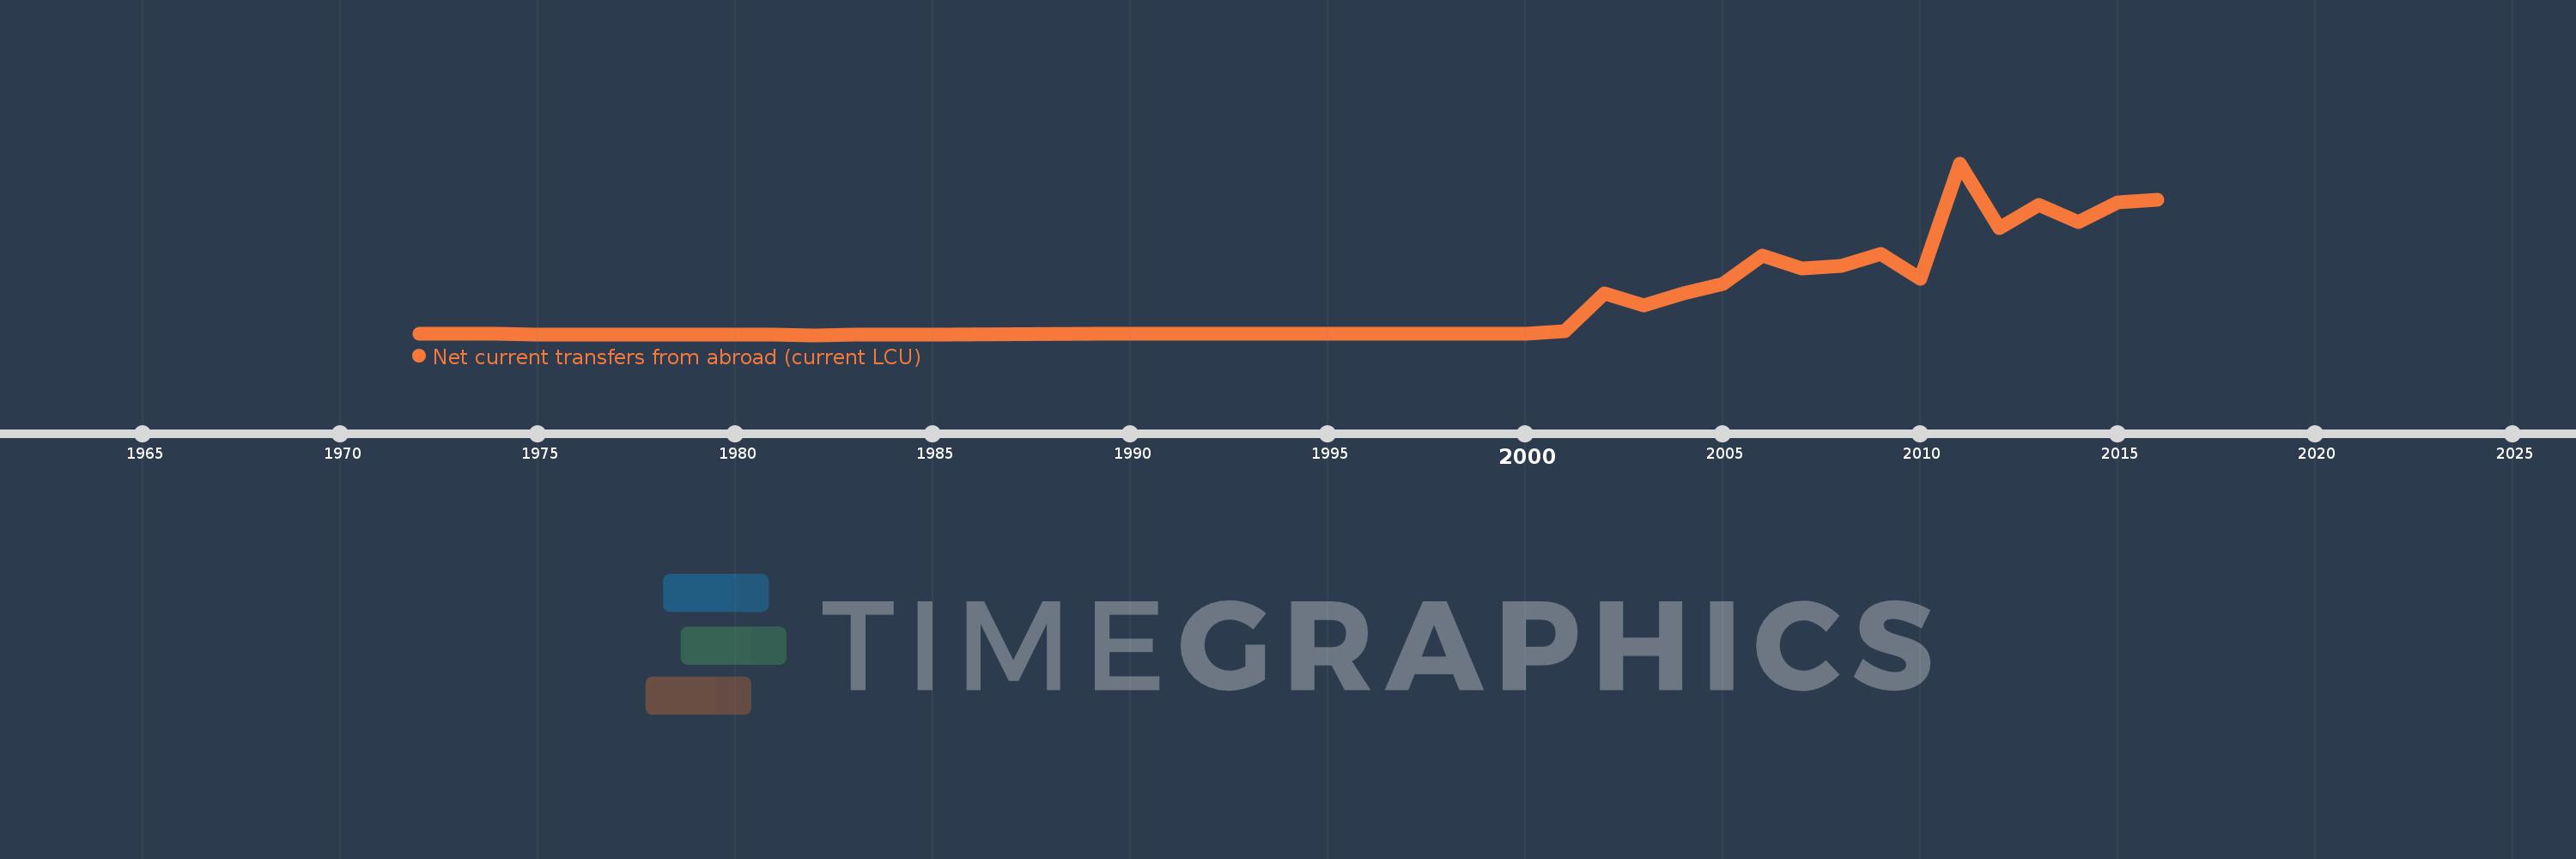
Net current transfers from abroad (current LCU)
2016,2015,2014,2013,2012,2011,2010,2009,2008,2007,2006,2005,2004,2003,2002,2001,2000,1999,1998,1997,1996,1995,1994,1993,1992,1991,1990,1989,1985,1984,1983,1982,1981,1980,1979,1978,1977,1976,1975,1974,1973,1972
This statistics in other country:
AfghanistanAlbaniaAlgeriaAngolaAntigua and BarbudaArgentinaArmeniaAustraliaAustriaAzerbaijanBahamas, TheBangladeshBarbadosBelarusBelgiumBelizeBeninBermudaBhutanBoliviaBosnia and HerzegovinaBotswanaBrazilBrunei DarussalamBulgariaBurkina FasoBurundiCabo VerdeCambodiaCameroonCanadaCentral African RepublicChadChileChinaColombiaComorosCongo, Dem. Rep.Congo, Rep.Costa RicaCote d'IvoireCroatiaCzech RepublicDenmarkDjiboutiDominicaDominican RepublicEcuadorEgypt, Arab Rep.El SalvadorEquatorial GuineaEritreaEstoniaEthiopiaFaroe IslandsFijiFinlandFranceFrench PolynesiaGabonGambia, TheGeorgiaGermanyGhanaGreeceGrenadaGuatemalaGuineaGuinea-BissauGuyanaHaitiHondurasHong Kong SAR, ChinaHungaryIcelandIndiaIndonesiaIran, Islamic Rep.IraqIrelandIsraelItalyJamaicaJapanJordanKazakhstanKenyaKiribatiKorea, Rep.KosovoKyrgyz RepublicLao PDRLatviaLebanonLesothoLiberiaLibyaLithuaniaMacedonia, FYRMadagascarMalawiMalaysiaMaldivesMaliMauritaniaMauritiusMexicoMoldovaMongoliaMontenegroMoroccoMozambiqueMyanmarNamibiaNepalNetherlandsNew ZealandNicaraguaNigerNigeriaNorwayPakistanPalauPanamaPapua New GuineaParaguayPeruPhilippinesPolandPortugalRomaniaRussian FederationRwandaSamoaSao Tome and PrincipeSenegalSerbiaSeychellesSierra LeoneSingaporeSlovak RepublicSloveniaSolomon IslandsSouth AfricaSouth SudanSpainSri LankaSt. Kitts and NevisSt. LuciaSt. Vincent and the GrenadinesSudanSurinameSwazilandSwedenSwitzerlandSyrian Arab RepublicTajikistanTanzaniaThailandTimor-LesteTogoTongaTrinidad and TobagoTunisiaTurkeyTurkmenistanUgandaUkraineUnited KingdomUnited StatesUruguayUzbekistanVanuatuVenezuela, RBVietnamWest Bank and GazaYemen, Rep.ZambiaZimbabwe Timeline:
This timeline shows a graph from 1972 to 2016 of Niger. No data until 1971. Number of actual observations by date: 42.
Source name:
World Development Indicators
Source organization:
World Bank national accounts data, and OECD National Accounts data files.
Categories, topics:
Economy & Growth
Last updated:
apr 23, 2017
Indicators value changes by year
Minimum:
-1.85 bln
jan 1, 1982
Maximum:
222.489 bln
jan 1, 2011
At the date of observation
Value
Absolute change
Change from previous value
jan 1, 1972
-585.03 mln
-585.03 mln
0.0%
jan 1, 1973
-728.246 mln
-143.216 mln
24.48%
jan 1, 1974
-540.086 mln
+188.16 mln
-25.84%
jan 1, 1975
-839.766 mln
-299.68 mln
55.49%
jan 1, 1976
-1.207 bln
-367.517 mln
43.76%
jan 1, 1977
-1.098 bln
+109.122 mln
-9.04%
jan 1, 1978
-1.05 bln
+48.171 mln
-4.39%
jan 1, 1979
-1.387 bln
-336.809 mln
32.08%
jan 1, 1980
-1.675 bln
-288.474 mln
20.8%
jan 1, 1981
-1.407 bln
+268.353 mln
-16.02%
jan 1, 1982
-1.85 bln
-443.173 mln
31.5%
jan 1, 1983
-1.667 bln
+183.35 mln
-9.91%
jan 1, 1984
-1.229 bln
+437.782 mln
-26.27%
jan 1, 1985
-733.638 mln
+495.325 mln
-40.3%
jan 1, 1989
6.378 mln
+740.016 mln
-100.87%
jan 1, 1990
10.658 mln
+4.28 mln
67.11%
jan 1, 1991
-24.61 mln
-35.268 mln
-330.9%
jan 1, 1992
-19.851 mln
+4.759 mln
-19.34%
jan 1, 1993
-5.289 mln
+14.562 mln
-73.36%
jan 1, 1994
27.542 mln
+32.831 mln
-620.75%
jan 1, 1995
-40.886 mln
-68.429 mln
-248.45%
jan 1, 1996
-22.641 mln
+18.245 mln
-44.62%
jan 1, 1997
-25.41 mln
-2.77 mln
12.23%
jan 1, 1998
-22.273 mln
+3.138 mln
-12.35%
jan 1, 1999
-5.763 mln
+16.51 mln
-74.12%
jan 1, 2000
-4.879 mln
+884.3K
-15.34%
jan 1, 2001
2.7 bln
+2.705 bln
-55.44K%
jan 1, 2002
52.739 bln
+50.039 bln
1.85K%
jan 1, 2003
37.018 bln
-15.721 bln
-29.81%
jan 1, 2004
52.702 bln
+15.685 bln
42.37%
jan 1, 2005
64.918 bln
+12.215 bln
23.18%
jan 1, 2006
102.057 bln
+37.14 bln
57.21%
jan 1, 2007
85.5 bln
-16.558 bln
-16.22%
jan 1, 2008
88.889 bln
+3.389 bln
3.96%
jan 1, 2009
103.632 bln
+14.742 bln
16.59%
jan 1, 2010
71.416 bln
-32.216 bln
-31.09%
jan 1, 2011
222.489 bln
+151.073 bln
211.54%
jan 1, 2012
137.632 bln
-84.857 bln
-38.14%
jan 1, 2013
167.8 bln
+30.168 bln
21.92%
jan 1, 2014
145.977 bln
-21.823 bln
-13.01%
jan 1, 2015
171.788 bln
+25.811 bln
17.68%
jan 1, 2016
174.429 bln
+2.641 bln
1.54%
Ranking of countries by current statistics by years


Comments: