29
/
en
AIzaSyAYiBZKx7MnpbEhh9jyipgxe19OcubqV5w
April 1, 2024
70177
Argentina
ARG
true
2
1
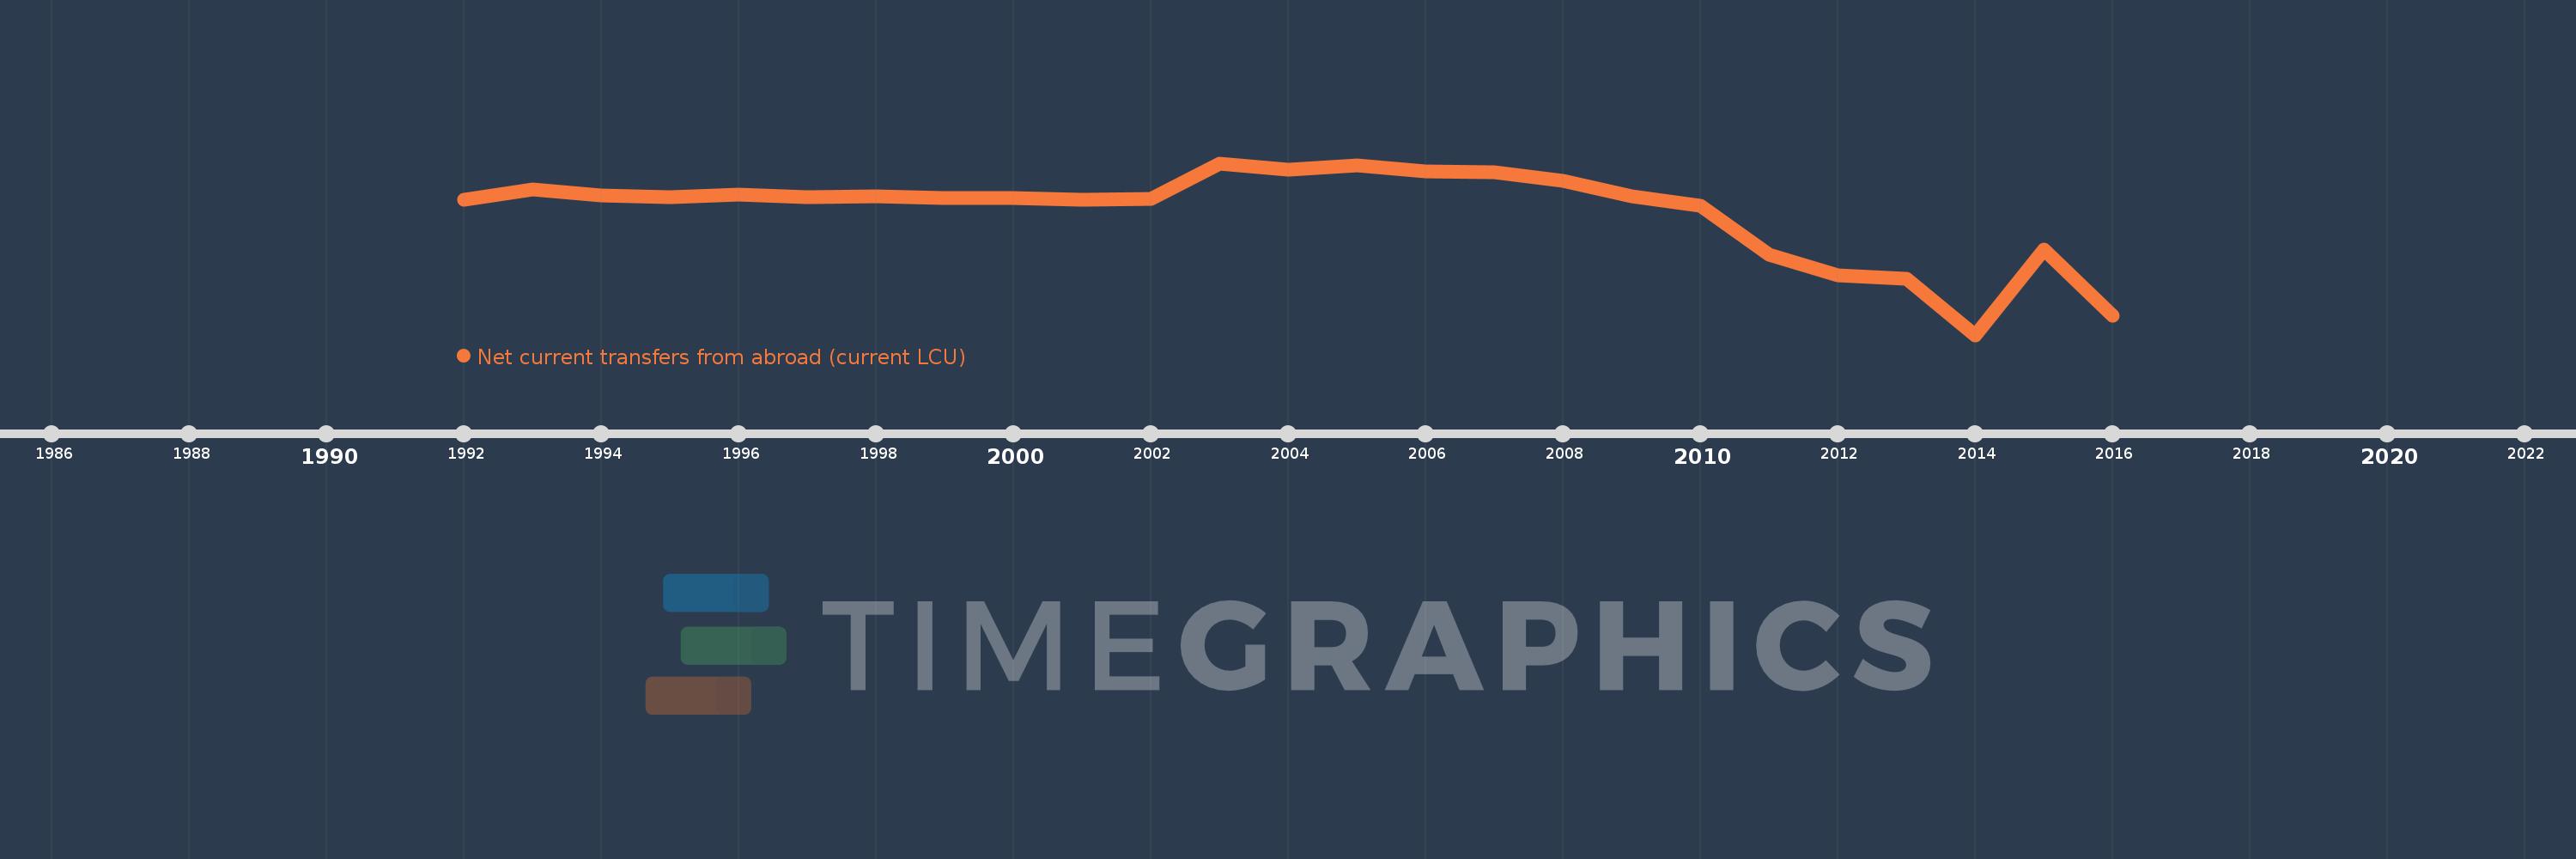
Net current transfers from abroad (current LCU)
2016,2015,2014,2013,2012,2011,2010,2009,2008,2007,2006,2005,2004,2003,2002,2001,2000,1999,1998,1997,1996,1995,1994,1993,1992
This statistics in other country:
AfghanistanAlbaniaAlgeriaAngolaAntigua and BarbudaArgentinaArmeniaAustraliaAustriaAzerbaijanBahamas, TheBangladeshBarbadosBelarusBelgiumBelizeBeninBermudaBhutanBoliviaBosnia and HerzegovinaBotswanaBrazilBrunei DarussalamBulgariaBurkina FasoBurundiCabo VerdeCambodiaCameroonCanadaCentral African RepublicChadChileChinaColombiaComorosCongo, Dem. Rep.Congo, Rep.Costa RicaCote d'IvoireCroatiaCzech RepublicDenmarkDjiboutiDominicaDominican RepublicEcuadorEgypt, Arab Rep.El SalvadorEquatorial GuineaEritreaEstoniaEthiopiaFaroe IslandsFijiFinlandFranceFrench PolynesiaGabonGambia, TheGeorgiaGermanyGhanaGreeceGrenadaGuatemalaGuineaGuinea-BissauGuyanaHaitiHondurasHong Kong SAR, ChinaHungaryIcelandIndiaIndonesiaIran, Islamic Rep.IraqIrelandIsraelItalyJamaicaJapanJordanKazakhstanKenyaKiribatiKorea, Rep.KosovoKyrgyz RepublicLao PDRLatviaLebanonLesothoLiberiaLibyaLithuaniaMacedonia, FYRMadagascarMalawiMalaysiaMaldivesMaliMauritaniaMauritiusMexicoMoldovaMongoliaMontenegroMoroccoMozambiqueMyanmarNamibiaNepalNetherlandsNew ZealandNicaraguaNigerNigeriaNorwayPakistanPalauPanamaPapua New GuineaParaguayPeruPhilippinesPolandPortugalRomaniaRussian FederationRwandaSamoaSao Tome and PrincipeSenegalSerbiaSeychellesSierra LeoneSingaporeSlovak RepublicSloveniaSolomon IslandsSouth AfricaSouth SudanSpainSri LankaSt. Kitts and NevisSt. LuciaSt. Vincent and the GrenadinesSudanSurinameSwazilandSwedenSwitzerlandSyrian Arab RepublicTajikistanTanzaniaThailandTimor-LesteTogoTongaTrinidad and TobagoTunisiaTurkeyTurkmenistanUgandaUkraineUnited KingdomUnited StatesUruguayUzbekistanVanuatuVenezuela, RBVietnamWest Bank and GazaYemen, Rep.ZambiaZimbabwe Timeline:
This timeline shows a graph from 1992 to 2016 of Argentina. No data until 1991. Number of actual observations by date: 25.
Source name:
World Development Indicators
Source organization:
World Bank national accounts data, and OECD National Accounts data files.
Categories, topics:
Economy & Growth
Last updated:
apr 23, 2017
Indicators value changes by year
Minimum:
-4.507 bln
jan 1, 2014
Maximum:
1.727 bln
jan 1, 2003
At the date of observation
Value
Absolute change
Change from previous value
jan 1, 1992
400.684 mln
+400.684 mln
0.0%
jan 1, 1993
781.782 mln
+381.098 mln
95.11%
jan 1, 1994
551.648 mln
-230.134 mln
-29.44%
jan 1, 1995
497.2 mln
-54.448 mln
-9.87%
jan 1, 1996
596.8 mln
+99.6 mln
20.03%
jan 1, 1997
482.2 mln
-114.6 mln
-19.2%
jan 1, 1998
514.858 mln
+32.658 mln
6.77%
jan 1, 1999
464.068 mln
-50.789 mln
-9.86%
jan 1, 2000
453.31 mln
-10.758 mln
-2.32%
jan 1, 2001
399.036 mln
-54.274 mln
-11.97%
jan 1, 2002
424.495 mln
+25.459 mln
6.38%
jan 1, 2003
1.727 bln
+1.303 bln
306.9%
jan 1, 2004
1.485 bln
-242.005 mln
-14.01%
jan 1, 2005
1.653 bln
+167.554 mln
11.28%
jan 1, 2006
1.418 bln
-234.47 mln
-14.19%
jan 1, 2007
1.414 bln
-4.035 mln
-0.28%
jan 1, 2008
1.103 bln
-311.754 mln
-22.04%
jan 1, 2009
539.453 mln
-563.109 mln
-51.07%
jan 1, 2010
178.707 mln
-360.746 mln
-66.87%
jan 1, 2011
-1.6 bln
-1.778 bln
-995.05%
jan 1, 2012
-2.328 bln
-728.189 mln
45.53%
jan 1, 2013
-2.452 bln
-124.675 mln
5.36%
jan 1, 2014
-4.507 bln
-2.055 bln
83.8%
jan 1, 2015
-1.411 bln
+3.096 bln
-68.7%
jan 1, 2016
-3.815 bln
-2.404 bln
170.38%
Ranking of countries by current statistics by years


Comments: