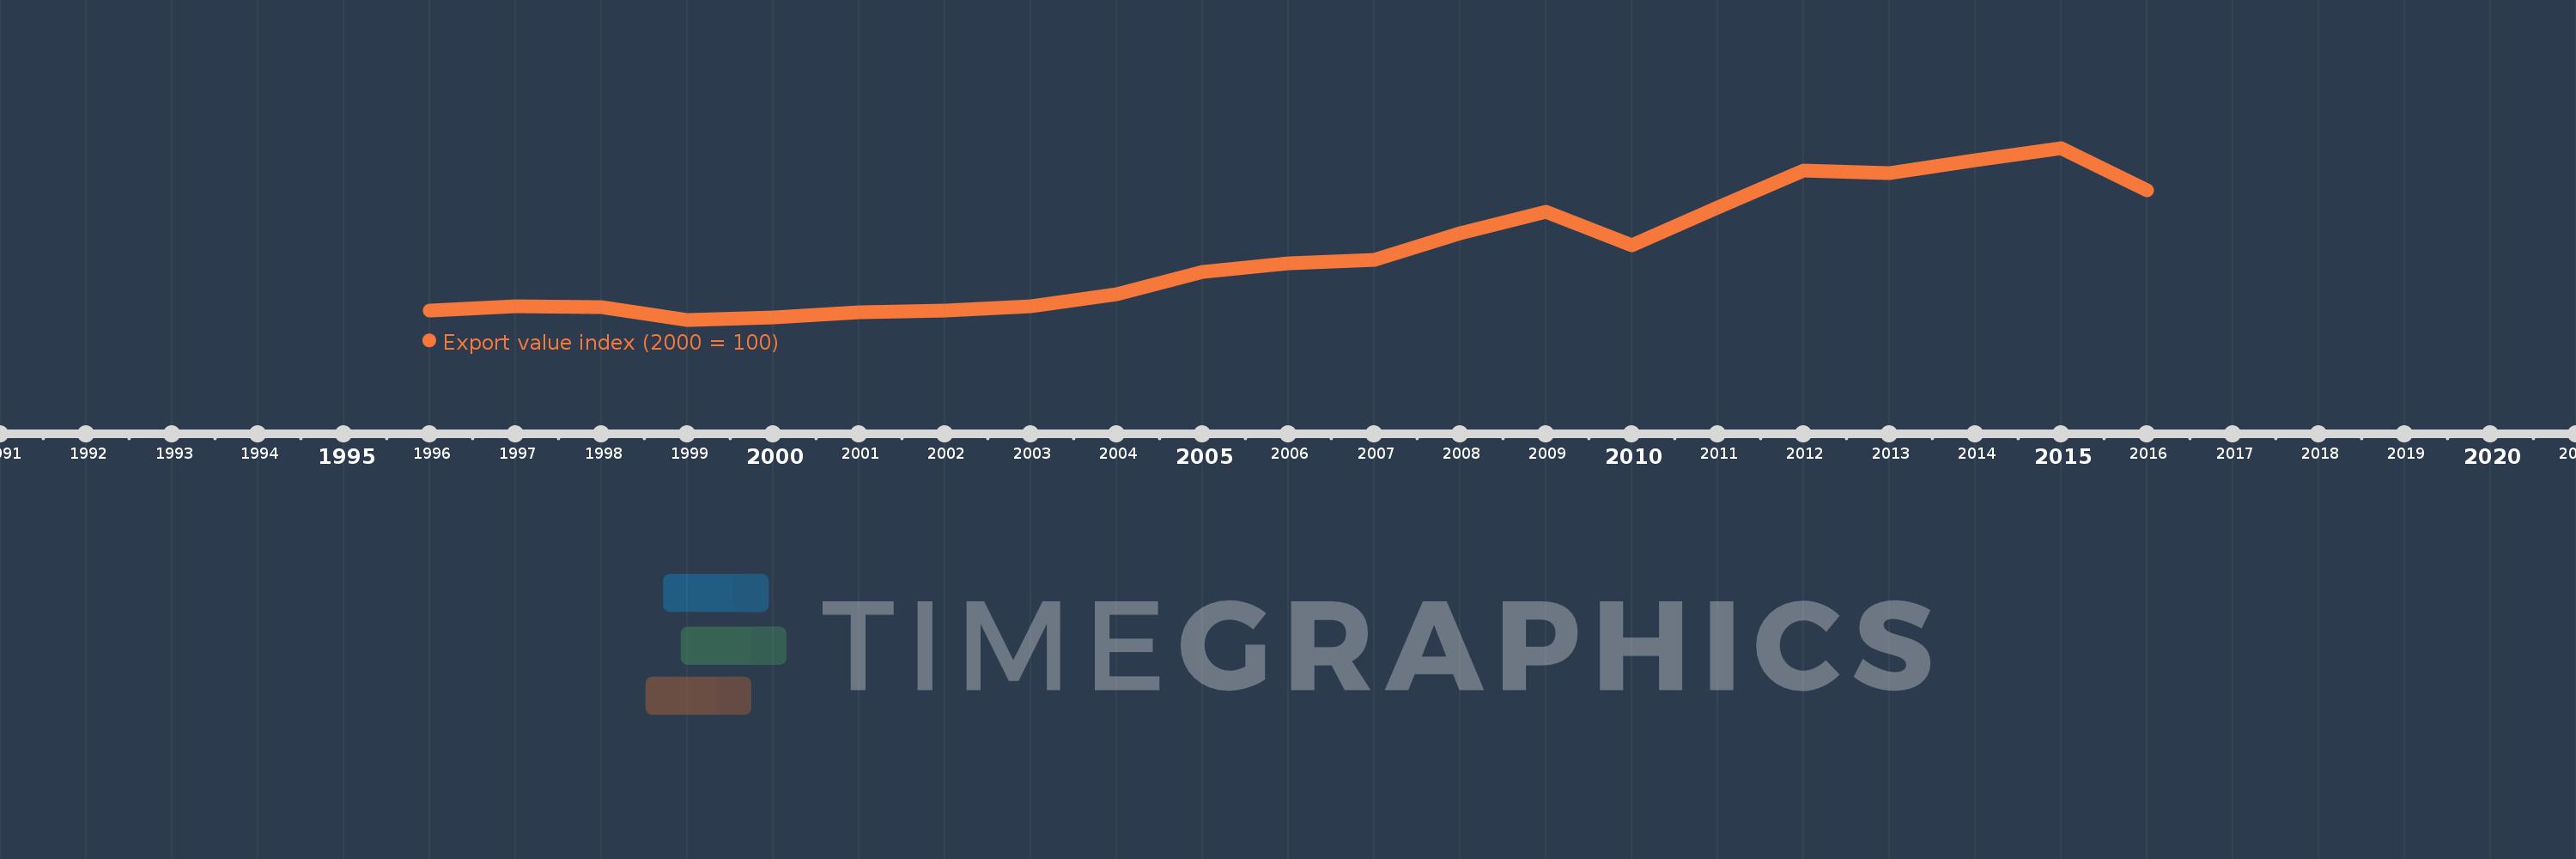
This timeline shows a graph from 1996 to 2016 of New Zealand. No data until 1995. Number of actual observations by date: 21.
Source name:
World Development Indicators
Source organization:
United Nations Conference on Trade and Development, Handbook of Statistics and data files, and International Monetary Fund, International Financial Statistics.
Categories, topics:
Private Sector, Trade
Last updated:
apr 23, 2017
Indicators value changes by year
Meaning:
176.711
Minimum:
90.872
jan 1, 1999
Maximum:
313.009
jan 1, 2015
At the date of observation
Value
Absolute change
Change from the previous value
jan 1, 1996
102.612
+102.612
0.0%
jan 1, 1997
108.004
+5.391
5.25%
jan 1, 1998
106.96
-1.044
-0.97%
jan 1, 1999
90.872
-16.087
-15.04%
jan 1, 2000
93.807
+2.935
3.23%
jan 1, 2001
100.0
+6.193
6.6%
jan 1, 2002
103.253
+3.253
3.25%
jan 1, 2003
108.164
+4.911
4.76%
jan 1, 2004
124.287
+16.123
14.91%
jan 1, 2005
152.992
+28.705
23.1%
jan 1, 2006
163.416
+10.424
6.81%
jan 1, 2007
168.523
+5.107
3.13%
jan 1, 2008
202.621
+34.098
20.23%
jan 1, 2009
229.97
+27.349
13.5%
jan 1, 2010
187.499
-42.471
-18.47%
jan 1, 2011
236.109
+48.609
25.92%
jan 1, 2012
283.277
+47.169
19.98%
jan 1, 2013
280.542
-2.735
-0.97%
jan 1, 2014
296.635
+16.093
5.74%
jan 1, 2015
313.009
+16.374
5.52%
jan 1, 2016
258.387
-54.622
-17.45%
Ranking of countries by current statistics by years
