29
/
en
AIzaSyAYiBZKx7MnpbEhh9jyipgxe19OcubqV5w
April 1, 2024
250710
St. Lucia
LCA
true
2
1
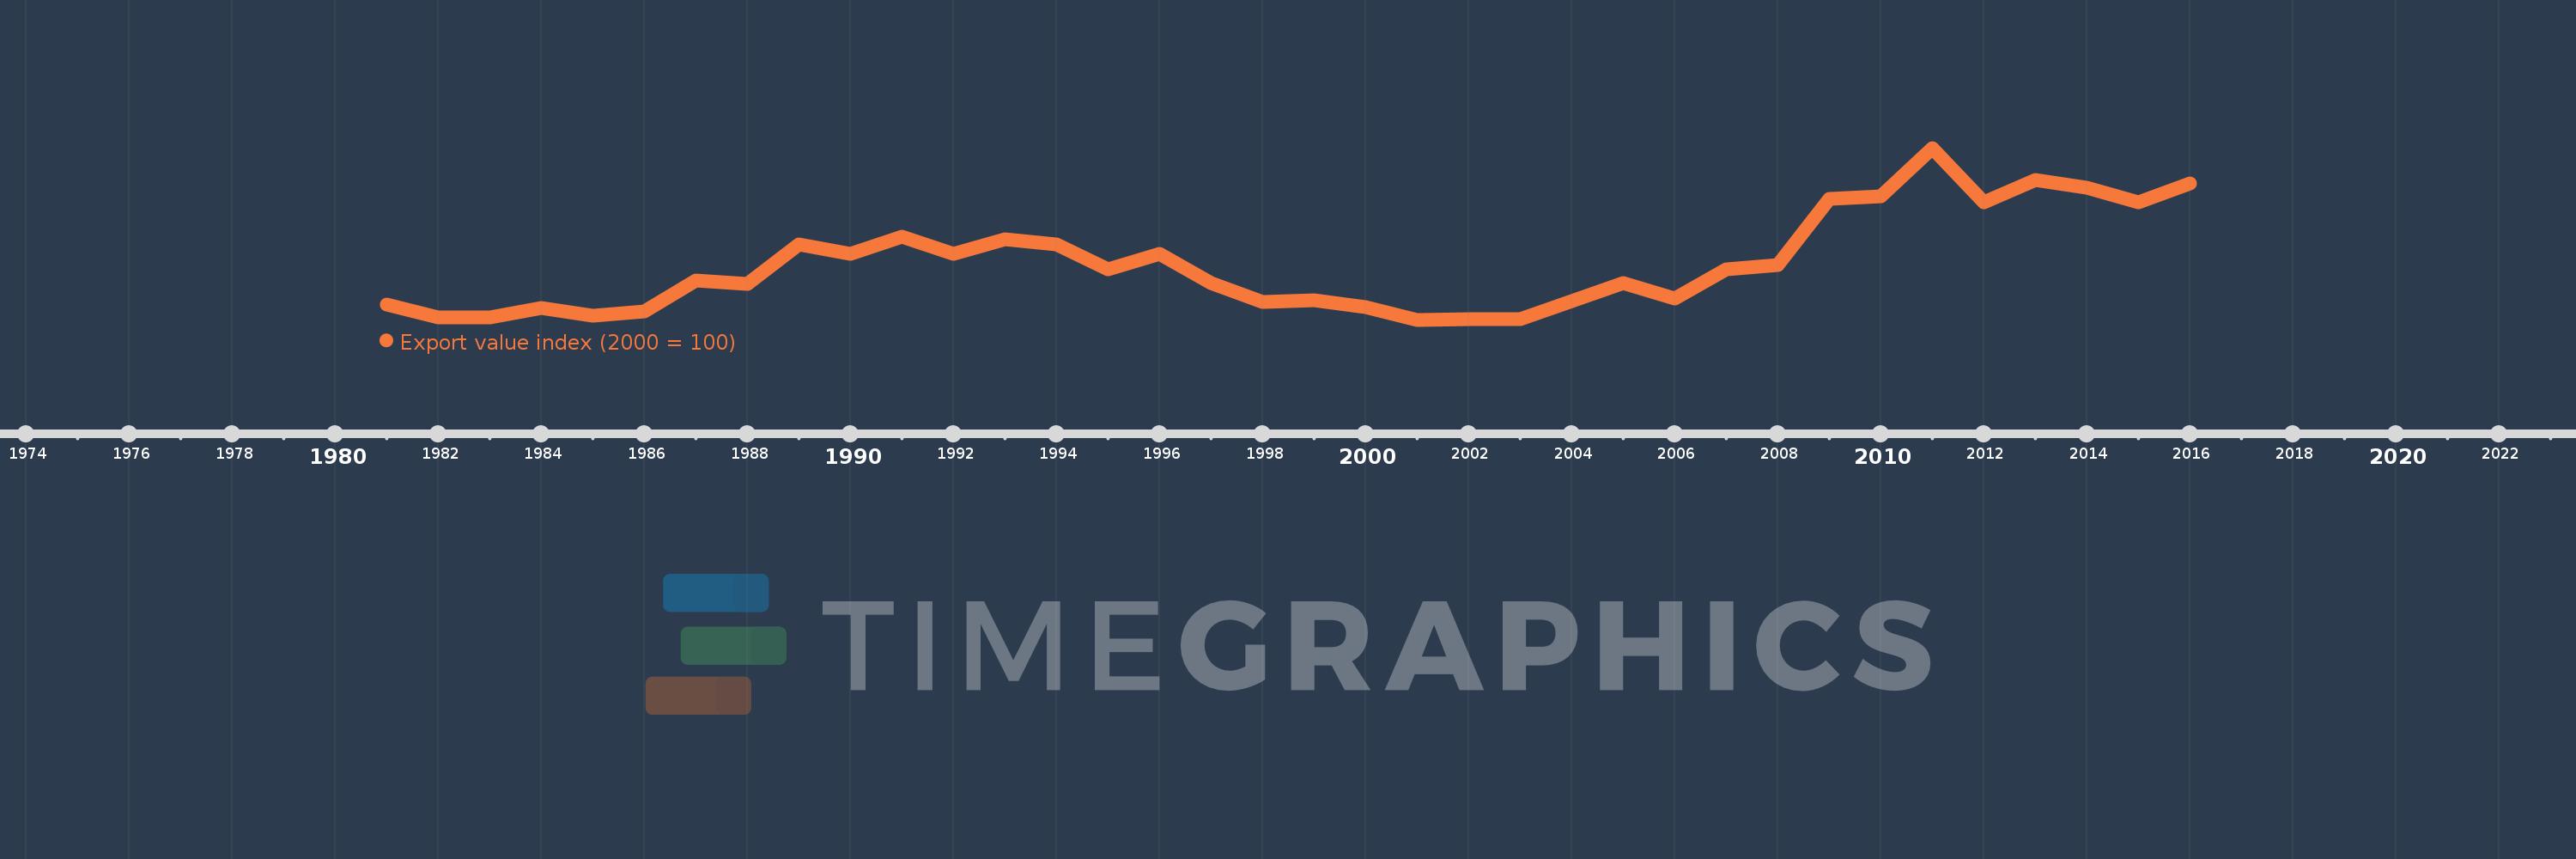
Export value index (2000 = 100)
2016,2015,2014,2013,2012,2011,2010,2009,2008,2007,2006,2005,2004,2003,2002,2001,2000,1999,1998,1997,1996,1995,1994,1993,1992,1991,1990,1989,1988,1987,1986,1985,1984,1983,1982,1981
This statistics in other country:
AfghanistanAlbaniaAlgeriaAmerican SamoaAndorraAngolaAntigua and BarbudaArgentinaArmeniaArubaAustraliaAustriaAzerbaijanBahamas, TheBahrainBangladeshBarbadosBelarusBelgiumBelizeBeninBermudaBhutanBoliviaBosnia and HerzegovinaBotswanaBrazilBritish Virgin IslandsBrunei DarussalamBulgariaBurkina FasoBurundiCabo VerdeCambodiaCameroonCanadaCayman IslandsCentral African RepublicChadChileChinaColombiaComorosCongo, Dem. Rep.Congo, Rep.Costa RicaCote d'IvoireCroatiaCubaCuracaoCyprusCzech RepublicDenmarkDjiboutiDominicaDominican RepublicEcuadorEgypt, Arab Rep.El SalvadorEquatorial GuineaEritreaEstoniaEthiopiaFaroe IslandsFijiFinlandFranceFrench PolynesiaGabonGambia, TheGeorgiaGermanyGhanaGibraltarGreeceGreenlandGrenadaGuamGuatemalaGuineaGuinea-BissauGuyanaHaitiHondurasHong Kong SAR, ChinaHungaryIcelandIndiaIndonesiaIran, Islamic Rep.IraqIrelandIsraelItalyJamaicaJapanJordanKazakhstanKenyaKiribatiKorea, Dem. People’s Rep.Korea, Rep.KuwaitKyrgyz RepublicLao PDRLatviaLebanonLesothoLiberiaLibyaLithuaniaLuxembourgMacao SAR, ChinaMacedonia, FYRMadagascarMalawiMalaysiaMaldivesMaliMaltaMarshall IslandsMauritaniaMauritiusMexicoMicronesia, Fed. Sts.MoldovaMongoliaMoroccoMozambiqueMyanmarNamibiaNauruNepalNetherlandsNew CaledoniaNew ZealandNicaraguaNigerNigeriaNorthern Mariana IslandsNorwayOmanPakistanPalauPanamaPapua New GuineaParaguayPeruPhilippinesPolandPortugalQatarRomaniaRussian FederationRwandaSamoaSao Tome and PrincipeSaudi ArabiaSenegalSerbiaSeychellesSierra LeoneSingaporeSlovak RepublicSloveniaSolomon IslandsSomaliaSouth AfricaSpainSri LankaSt. Kitts and NevisSt. LuciaSt. Vincent and the GrenadinesSudanSurinameSwazilandSwedenSwitzerlandSyrian Arab RepublicTajikistanTanzaniaThailandTogoTongaTrinidad and TobagoTunisiaTurkeyTurkmenistanTurks and Caicos IslandsUgandaUkraineUnited Arab EmiratesUnited KingdomUnited StatesUruguayUzbekistanVanuatuVenezuela, RBVietnamWest Bank and GazaYemen, Rep.ZambiaZimbabwe Timeline:
This timeline shows a graph from 1981 to 2016 of St. Lucia. No data until 1980. Number of actual observations by date: 36.
Source name:
World Development Indicators
Source organization:
United Nations Conference on Trade and Development, Handbook of Statistics and data files, and International Monetary Fund, International Financial Statistics.
Categories, topics:
Private Sector, Trade
Last updated:
apr 23, 2017
Indicators value changes by year
Maximum:
498.872
jan 1, 2011
At the date of observation
Value
Absolute change
Change from previous value
jan 1, 1981
134.435
+134.435
0.0%
jan 1, 1982
106.209
-28.226
-21.0%
jan 1, 1983
104.902
-1.307
-1.23%
jan 1, 1984
127.79
+22.888
21.82%
jan 1, 1985
110.257
-17.533
-13.72%
jan 1, 1986
119.908
+9.651
8.75%
jan 1, 1987
191.22
+71.313
59.47%
jan 1, 1988
183.363
-7.857
-4.11%
jan 1, 1989
274.66
+91.297
49.79%
jan 1, 1990
252.027
-22.633
-8.24%
jan 1, 1991
293.534
+41.507
16.47%
jan 1, 1992
253.31
-40.224
-13.7%
jan 1, 1993
286.019
+32.709
12.91%
jan 1, 1994
275.857
-10.162
-3.55%
jan 1, 1995
217.61
-58.247
-21.11%
jan 1, 1996
253.488
+35.878
16.49%
jan 1, 1997
186.047
-67.442
-26.61%
jan 1, 1998
141.86
-44.186
-23.75%
jan 1, 1999
144.651
+2.791
1.97%
jan 1, 2000
129.535
-15.116
-10.45%
jan 1, 2001
100.0
-29.535
-22.8%
jan 1, 2002
102.326
+2.326
2.33%
jan 1, 2003
102.326
0.0
0.0%
jan 1, 2004
144.186
+41.86
40.91%
jan 1, 2005
185.54
+41.353
28.68%
jan 1, 2006
149.349
-36.191
-19.51%
jan 1, 2007
218.014
+68.665
45.98%
jan 1, 2008
227.907
+9.893
4.54%
jan 1, 2009
381.447
+153.54
67.37%
jan 1, 2010
385.944
+4.498
1.18%
jan 1, 2011
498.872
+112.928
29.26%
jan 1, 2012
372.297
-126.575
-25.37%
jan 1, 2013
424.263
+51.966
13.96%
jan 1, 2014
405.57
-18.693
-4.41%
jan 1, 2015
373.428
-32.142
-7.93%
jan 1, 2016
416.861
+43.433
11.63%
Ranking of countries by current statistics by years


Comments: