29
/
en
AIzaSyAYiBZKx7MnpbEhh9jyipgxe19OcubqV5w
April 1, 2024
266774
Trinidad and Tobago
TTO
true
2
1
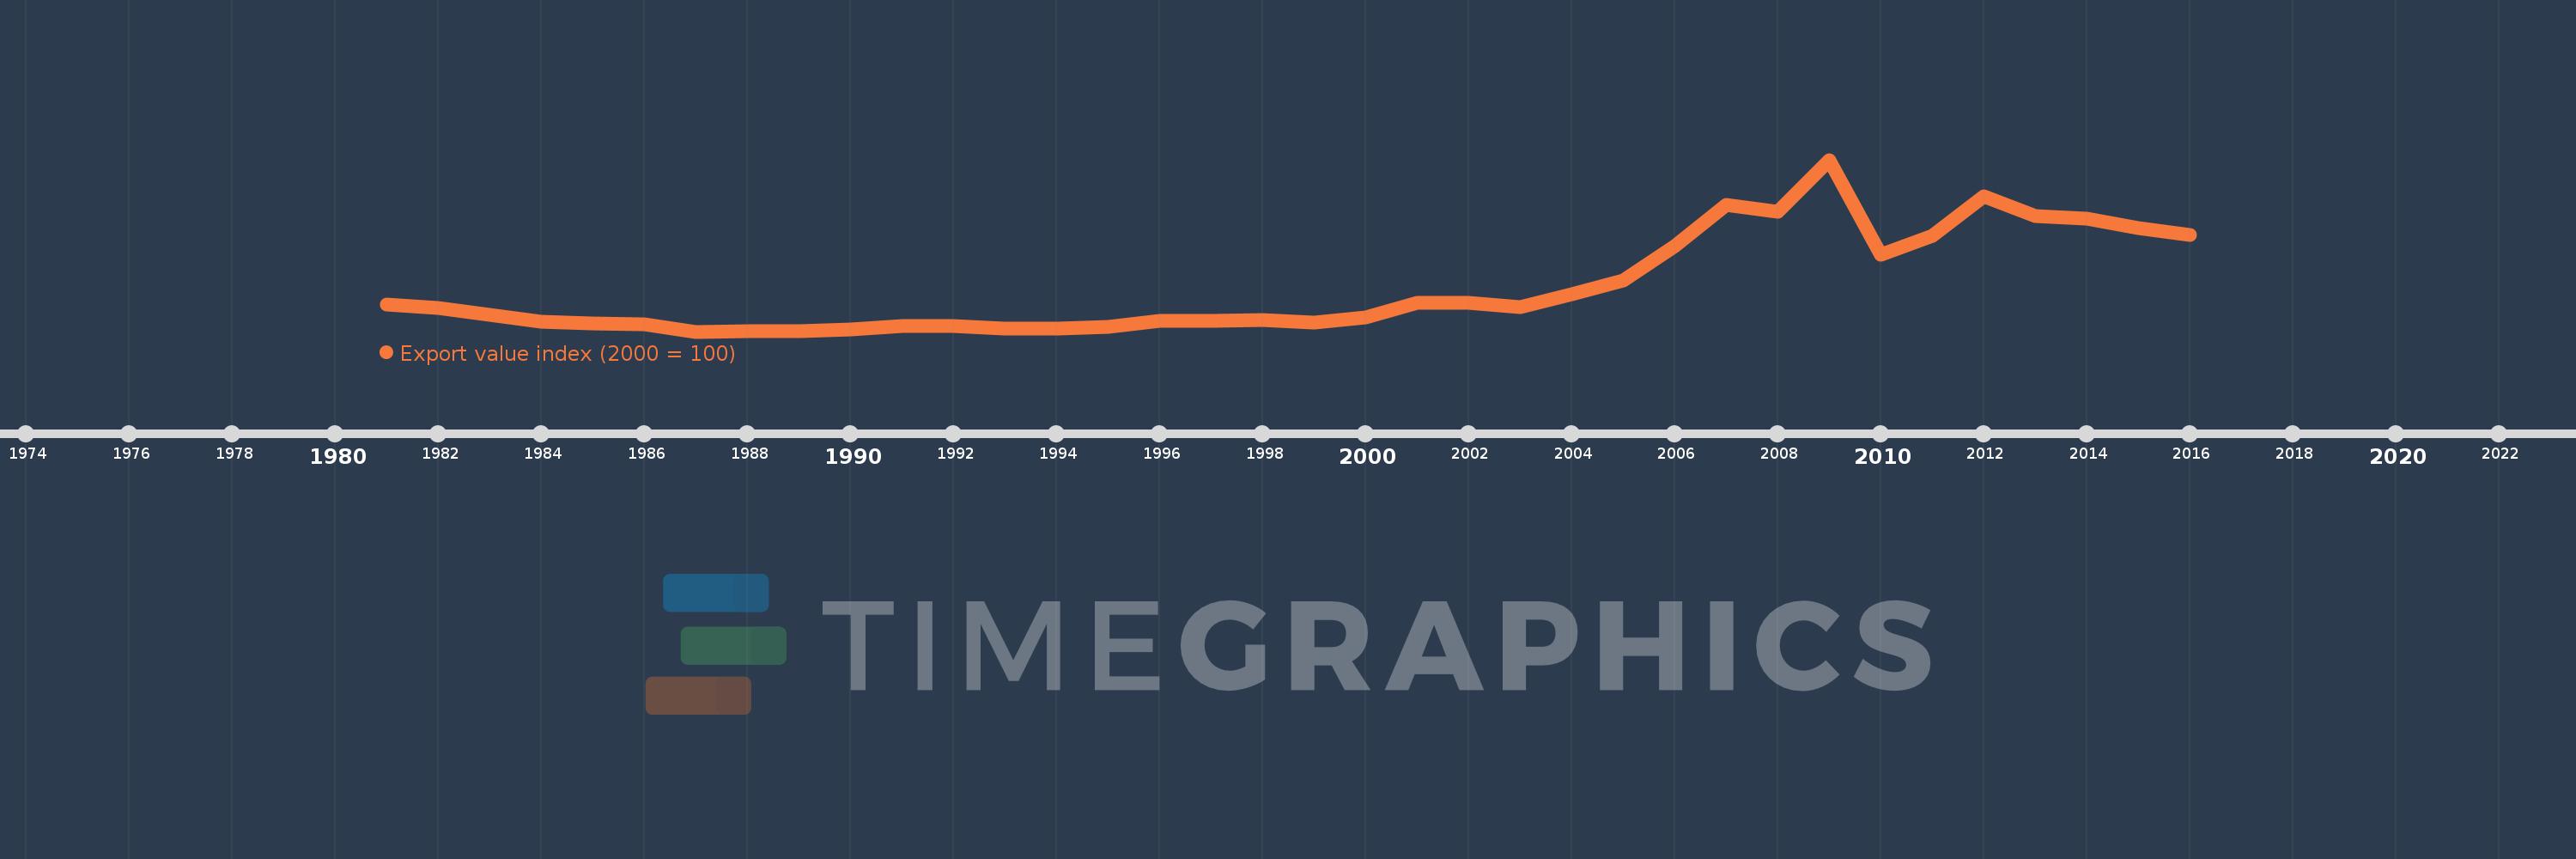
Export value index (2000 = 100)
2016,2015,2014,2013,2012,2011,2010,2009,2008,2007,2006,2005,2004,2003,2002,2001,2000,1999,1998,1997,1996,1995,1994,1993,1992,1991,1990,1989,1988,1987,1986,1985,1984,1983,1982,1981
This statistics in other country:
AfghanistanAlbaniaAlgeriaAmerican SamoaAndorraAngolaAntigua and BarbudaArgentinaArmeniaArubaAustraliaAustriaAzerbaijanBahamas, TheBahrainBangladeshBarbadosBelarusBelgiumBelizeBeninBermudaBhutanBoliviaBosnia and HerzegovinaBotswanaBrazilBritish Virgin IslandsBrunei DarussalamBulgariaBurkina FasoBurundiCabo VerdeCambodiaCameroonCanadaCayman IslandsCentral African RepublicChadChileChinaColombiaComorosCongo, Dem. Rep.Congo, Rep.Costa RicaCote d'IvoireCroatiaCubaCuracaoCyprusCzech RepublicDenmarkDjiboutiDominicaDominican RepublicEcuadorEgypt, Arab Rep.El SalvadorEquatorial GuineaEritreaEstoniaEthiopiaFaroe IslandsFijiFinlandFranceFrench PolynesiaGabonGambia, TheGeorgiaGermanyGhanaGibraltarGreeceGreenlandGrenadaGuamGuatemalaGuineaGuinea-BissauGuyanaHaitiHondurasHong Kong SAR, ChinaHungaryIcelandIndiaIndonesiaIran, Islamic Rep.IraqIrelandIsraelItalyJamaicaJapanJordanKazakhstanKenyaKiribatiKorea, Dem. People’s Rep.Korea, Rep.KuwaitKyrgyz RepublicLao PDRLatviaLebanonLesothoLiberiaLibyaLithuaniaLuxembourgMacao SAR, ChinaMacedonia, FYRMadagascarMalawiMalaysiaMaldivesMaliMaltaMarshall IslandsMauritaniaMauritiusMexicoMicronesia, Fed. Sts.MoldovaMongoliaMoroccoMozambiqueMyanmarNamibiaNauruNepalNetherlandsNew CaledoniaNew ZealandNicaraguaNigerNigeriaNorthern Mariana IslandsNorwayOmanPakistanPalauPanamaPapua New GuineaParaguayPeruPhilippinesPolandPortugalQatarRomaniaRussian FederationRwandaSamoaSao Tome and PrincipeSaudi ArabiaSenegalSerbiaSeychellesSierra LeoneSingaporeSlovak RepublicSloveniaSolomon IslandsSomaliaSouth AfricaSpainSri LankaSt. Kitts and NevisSt. LuciaSt. Vincent and the GrenadinesSudanSurinameSwazilandSwedenSwitzerlandSyrian Arab RepublicTajikistanTanzaniaThailandTogoTongaTrinidad and TobagoTunisiaTurkeyTurkmenistanTurks and Caicos IslandsUgandaUkraineUnited Arab EmiratesUnited KingdomUnited StatesUruguayUzbekistanVanuatuVenezuela, RBVietnamWest Bank and GazaYemen, Rep.ZambiaZimbabwe Timeline:
This timeline shows a graph from 1981 to 2016 of Trinidad and Tobago. No data until 1980. Number of actual observations by date: 36.
Source name:
World Development Indicators
Source organization:
United Nations Conference on Trade and Development, Handbook of Statistics and data files, and International Monetary Fund, International Financial Statistics.
Categories, topics:
Private Sector, Trade
Last updated:
apr 23, 2017
Indicators value changes by year
Minimum:
32.424
jan 1, 1987
Maximum:
436.369
jan 1, 2009
At the date of observation
Value
Absolute change
Change from previous value
jan 1, 1981
95.397
+95.397
0.0%
jan 1, 1982
87.999
-7.398
-7.75%
jan 1, 1983
71.877
-16.122
-18.32%
jan 1, 1984
55.049
-16.828
-23.41%
jan 1, 1985
50.856
-4.193
-7.62%
jan 1, 1986
50.049
-0.806
-1.59%
jan 1, 1987
32.424
-17.625
-35.22%
jan 1, 1988
34.218
+1.794
5.53%
jan 1, 1989
33.037
-1.182
-3.45%
jan 1, 1990
36.926
+3.889
11.77%
jan 1, 1991
45.866
+8.94
24.21%
jan 1, 1992
46.448
+0.582
1.27%
jan 1, 1993
39.576
-6.872
-14.79%
jan 1, 1994
38.891
-0.685
-1.73%
jan 1, 1995
43.674
+4.783
12.3%
jan 1, 1996
57.425
+13.75
31.48%
jan 1, 1997
58.486
+1.061
1.85%
jan 1, 1998
59.502
+1.016
1.74%
jan 1, 1999
52.827
-6.675
-11.22%
jan 1, 2000
65.606
+12.779
24.19%
jan 1, 2001
100.0
+34.394
52.43%
jan 1, 2002
100.14
+0.14
0.14%
jan 1, 2003
90.781
-9.359
-9.35%
jan 1, 2004
121.142
+30.361
33.44%
jan 1, 2005
152.485
+31.343
25.87%
jan 1, 2006
232.608
+80.123
52.54%
jan 1, 2007
331.182
+98.574
42.38%
jan 1, 2008
313.436
-17.746
-5.36%
jan 1, 2009
436.369
+122.934
39.22%
jan 1, 2010
213.523
-222.846
-51.07%
jan 1, 2011
256.941
+43.419
20.33%
jan 1, 2012
349.647
+92.705
36.08%
jan 1, 2013
303.776
-45.871
-13.12%
jan 1, 2014
298.774
-5.002
-1.65%
jan 1, 2015
276.224
-22.55
-7.55%
jan 1, 2016
259.708
-16.516
-5.98%
Ranking of countries by current statistics by years


Comments: