29
/
en
AIzaSyAYiBZKx7MnpbEhh9jyipgxe19OcubqV5w
April 1, 2024
201492
Morocco
MAR
true
2
1
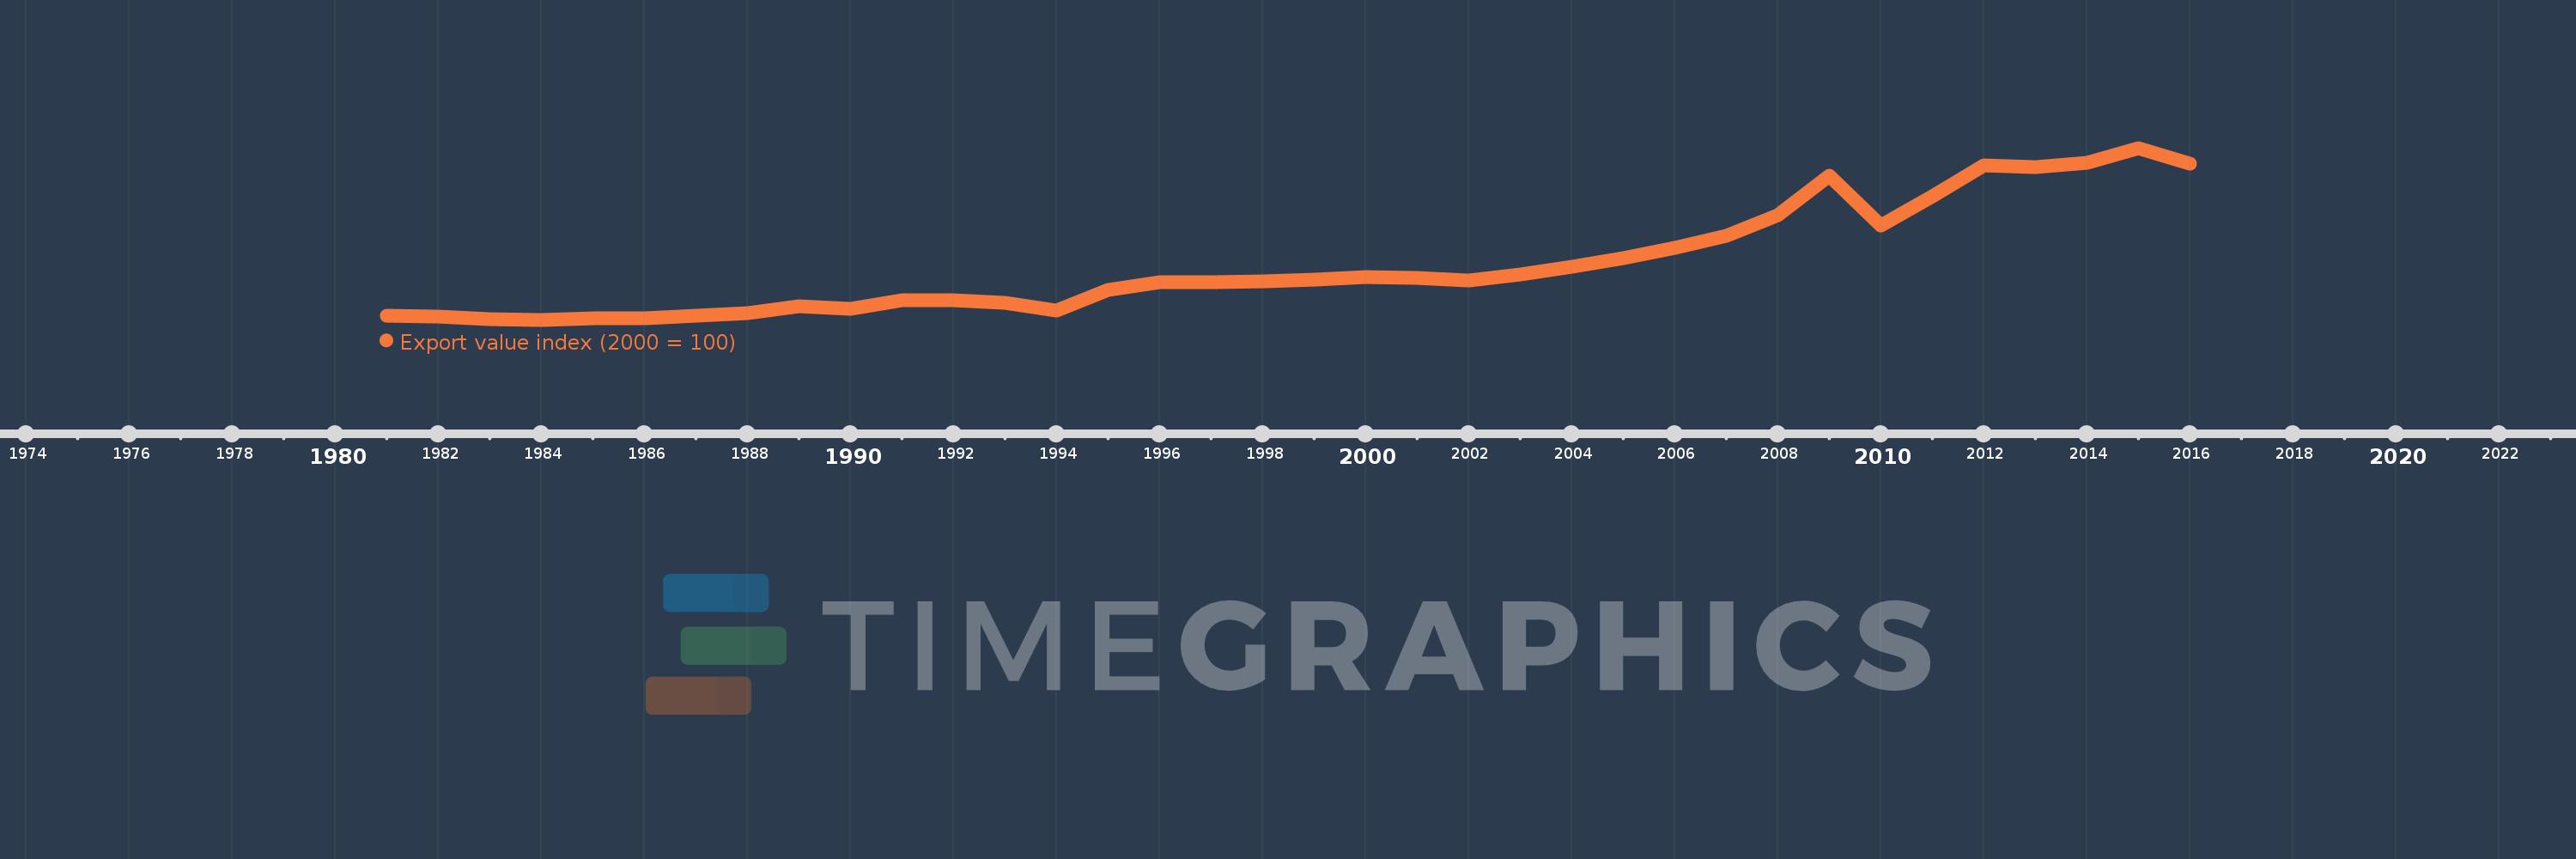
Export value index (2000 = 100)
2016,2015,2014,2013,2012,2011,2010,2009,2008,2007,2006,2005,2004,2003,2002,2001,2000,1999,1998,1997,1996,1995,1994,1993,1992,1991,1990,1989,1988,1987,1986,1985,1984,1983,1982,1981
This statistics in other country:
AfghanistanAlbaniaAlgeriaAmerican SamoaAndorraAngolaAntigua and BarbudaArgentinaArmeniaArubaAustraliaAustriaAzerbaijanBahamas, TheBahrainBangladeshBarbadosBelarusBelgiumBelizeBeninBermudaBhutanBoliviaBosnia and HerzegovinaBotswanaBrazilBritish Virgin IslandsBrunei DarussalamBulgariaBurkina FasoBurundiCabo VerdeCambodiaCameroonCanadaCayman IslandsCentral African RepublicChadChileChinaColombiaComorosCongo, Dem. Rep.Congo, Rep.Costa RicaCote d'IvoireCroatiaCubaCuracaoCyprusCzech RepublicDenmarkDjiboutiDominicaDominican RepublicEcuadorEgypt, Arab Rep.El SalvadorEquatorial GuineaEritreaEstoniaEthiopiaFaroe IslandsFijiFinlandFranceFrench PolynesiaGabonGambia, TheGeorgiaGermanyGhanaGibraltarGreeceGreenlandGrenadaGuamGuatemalaGuineaGuinea-BissauGuyanaHaitiHondurasHong Kong SAR, ChinaHungaryIcelandIndiaIndonesiaIran, Islamic Rep.IraqIrelandIsraelItalyJamaicaJapanJordanKazakhstanKenyaKiribatiKorea, Dem. People’s Rep.Korea, Rep.KuwaitKyrgyz RepublicLao PDRLatviaLebanonLesothoLiberiaLibyaLithuaniaLuxembourgMacao SAR, ChinaMacedonia, FYRMadagascarMalawiMalaysiaMaldivesMaliMaltaMarshall IslandsMauritaniaMauritiusMexicoMicronesia, Fed. Sts.MoldovaMongoliaMoroccoMozambiqueMyanmarNamibiaNauruNepalNetherlandsNew CaledoniaNew ZealandNicaraguaNigerNigeriaNorthern Mariana IslandsNorwayOmanPakistanPalauPanamaPapua New GuineaParaguayPeruPhilippinesPolandPortugalQatarRomaniaRussian FederationRwandaSamoaSao Tome and PrincipeSaudi ArabiaSenegalSerbiaSeychellesSierra LeoneSingaporeSlovak RepublicSloveniaSolomon IslandsSomaliaSouth AfricaSpainSri LankaSt. Kitts and NevisSt. LuciaSt. Vincent and the GrenadinesSudanSurinameSwazilandSwedenSwitzerlandSyrian Arab RepublicTajikistanTanzaniaThailandTogoTongaTrinidad and TobagoTunisiaTurkeyTurkmenistanTurks and Caicos IslandsUgandaUkraineUnited Arab EmiratesUnited KingdomUnited StatesUruguayUzbekistanVanuatuVenezuela, RBVietnamWest Bank and GazaYemen, Rep.ZambiaZimbabwe Timeline:
This timeline shows a graph from 1981 to 2016 of Morocco. No data until 1980. Number of actual observations by date: 36.
Source name:
World Development Indicators
Source organization:
United Nations Conference on Trade and Development, Handbook of Statistics and data files, and International Monetary Fund, International Financial Statistics.
Categories, topics:
Private Sector, Trade
Last updated:
apr 23, 2017
Indicators value changes by year
Minimum:
28.818
jan 1, 1984
Maximum:
320.591
jan 1, 2015
At the date of observation
Value
Absolute change
Change from previous value
jan 1, 1981
35.07
+35.07
0.0%
jan 1, 1982
34.274
-0.796
-2.27%
jan 1, 1983
29.624
-4.65
-13.57%
jan 1, 1984
28.818
-0.806
-2.72%
jan 1, 1985
31.19
+2.372
8.23%
jan 1, 1986
31.102
-0.087
-0.28%
jan 1, 1987
34.95
+3.848
12.37%
jan 1, 1988
40.326
+5.376
15.38%
jan 1, 1989
52.084
+11.757
29.16%
jan 1, 1990
47.932
-4.152
-7.97%
jan 1, 1991
61.271
+13.339
27.83%
jan 1, 1992
61.549
+0.278
0.45%
jan 1, 1993
57.075
-4.474
-7.27%
jan 1, 1994
43.88
-13.195
-23.12%
jan 1, 1995
79.81
+35.93
81.88%
jan 1, 1996
92.592
+12.782
16.02%
jan 1, 1997
92.589
-0.003
0.0%
jan 1, 1998
94.626
+2.036
2.2%
jan 1, 1999
96.244
+1.618
1.71%
jan 1, 2000
100.956
+4.713
4.9%
jan 1, 2001
100.0
-0.956
-0.95%
jan 1, 2002
96.127
-3.873
-3.87%
jan 1, 2003
105.613
+9.486
9.87%
jan 1, 2004
118.118
+12.505
11.84%
jan 1, 2005
133.548
+15.43
13.06%
jan 1, 2006
150.565
+17.018
12.74%
jan 1, 2007
171.476
+20.91
13.89%
jan 1, 2008
206.411
+34.935
20.37%
jan 1, 2009
273.752
+67.342
32.63%
jan 1, 2010
189.11
-84.643
-30.92%
jan 1, 2011
239.115
+50.006
26.44%
jan 1, 2012
291.367
+52.251
21.85%
jan 1, 2013
288.565
-2.802
-0.96%
jan 1, 2014
295.641
+7.076
2.45%
jan 1, 2015
320.591
+24.951
8.44%
jan 1, 2016
294.493
-26.099
-8.14%
Ranking of countries by current statistics by years


Comments: