29
/
en
AIzaSyAYiBZKx7MnpbEhh9jyipgxe19OcubqV5w
April 1, 2024
158391
Iraq
IRQ
true
2
1
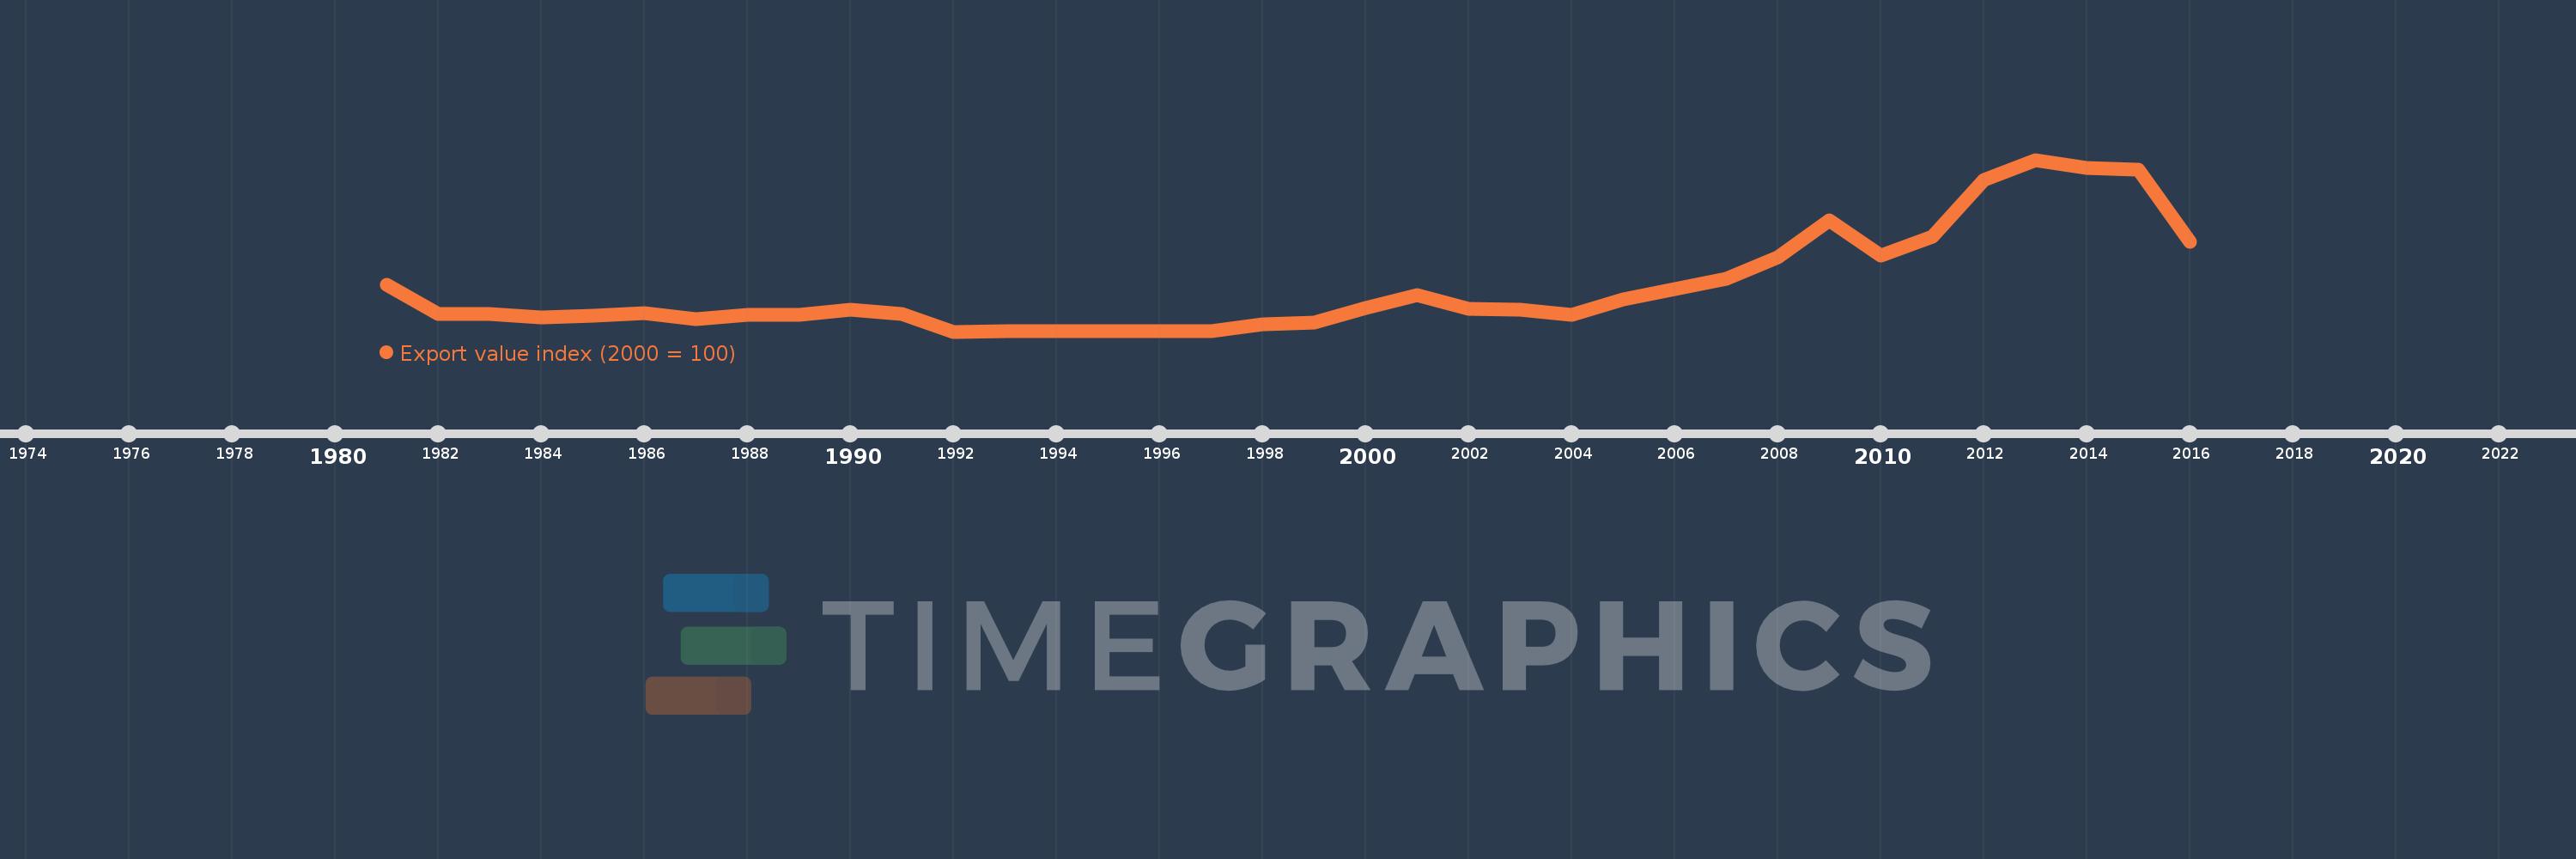
Export value index (2000 = 100)
2016,2015,2014,2013,2012,2011,2010,2009,2008,2007,2006,2005,2004,2003,2002,2001,2000,1999,1998,1997,1996,1995,1994,1993,1992,1991,1990,1989,1988,1987,1986,1985,1984,1983,1982,1981
This statistics in other country:
AfghanistanAlbaniaAlgeriaAmerican SamoaAndorraAngolaAntigua and BarbudaArgentinaArmeniaArubaAustraliaAustriaAzerbaijanBahamas, TheBahrainBangladeshBarbadosBelarusBelgiumBelizeBeninBermudaBhutanBoliviaBosnia and HerzegovinaBotswanaBrazilBritish Virgin IslandsBrunei DarussalamBulgariaBurkina FasoBurundiCabo VerdeCambodiaCameroonCanadaCayman IslandsCentral African RepublicChadChileChinaColombiaComorosCongo, Dem. Rep.Congo, Rep.Costa RicaCote d'IvoireCroatiaCubaCuracaoCyprusCzech RepublicDenmarkDjiboutiDominicaDominican RepublicEcuadorEgypt, Arab Rep.El SalvadorEquatorial GuineaEritreaEstoniaEthiopiaFaroe IslandsFijiFinlandFranceFrench PolynesiaGabonGambia, TheGeorgiaGermanyGhanaGibraltarGreeceGreenlandGrenadaGuamGuatemalaGuineaGuinea-BissauGuyanaHaitiHondurasHong Kong SAR, ChinaHungaryIcelandIndiaIndonesiaIran, Islamic Rep.IraqIrelandIsraelItalyJamaicaJapanJordanKazakhstanKenyaKiribatiKorea, Dem. People’s Rep.Korea, Rep.KuwaitKyrgyz RepublicLao PDRLatviaLebanonLesothoLiberiaLibyaLithuaniaLuxembourgMacao SAR, ChinaMacedonia, FYRMadagascarMalawiMalaysiaMaldivesMaliMaltaMarshall IslandsMauritaniaMauritiusMexicoMicronesia, Fed. Sts.MoldovaMongoliaMoroccoMozambiqueMyanmarNamibiaNauruNepalNetherlandsNew CaledoniaNew ZealandNicaraguaNigerNigeriaNorthern Mariana IslandsNorwayOmanPakistanPalauPanamaPapua New GuineaParaguayPeruPhilippinesPolandPortugalQatarRomaniaRussian FederationRwandaSamoaSao Tome and PrincipeSaudi ArabiaSenegalSerbiaSeychellesSierra LeoneSingaporeSlovak RepublicSloveniaSolomon IslandsSomaliaSouth AfricaSpainSri LankaSt. Kitts and NevisSt. LuciaSt. Vincent and the GrenadinesSudanSurinameSwazilandSwedenSwitzerlandSyrian Arab RepublicTajikistanTanzaniaThailandTogoTongaTrinidad and TobagoTunisiaTurkeyTurkmenistanTurks and Caicos IslandsUgandaUkraineUnited Arab EmiratesUnited KingdomUnited StatesUruguayUzbekistanVanuatuVenezuela, RBVietnamWest Bank and GazaYemen, Rep.ZambiaZimbabwe Timeline:
This timeline shows a graph from 1981 to 2016 of Iraq. No data until 1980. Number of actual observations by date: 36.
Source name:
World Development Indicators
Source organization:
United Nations Conference on Trade and Development, Handbook of Statistics and data files, and International Monetary Fund, International Financial Statistics.
Categories, topics:
Private Sector, Trade
Last updated:
apr 23, 2017
Indicators value changes by year
Maximum:
463.158
jan 1, 2013
At the date of observation
Value
Absolute change
Change from previous value
jan 1, 1981
127.889
+127.889
0.0%
jan 1, 1982
49.216
-78.673
-61.52%
jan 1, 1983
48.697
-0.519
-1.06%
jan 1, 1984
39.611
-9.086
-18.66%
jan 1, 1985
45.222
+5.611
14.16%
jan 1, 1986
50.522
+5.3
11.72%
jan 1, 1987
36.233
-14.289
-28.28%
jan 1, 1988
47.105
+10.872
30.01%
jan 1, 1989
46.639
-0.466
-0.99%
jan 1, 1990
59.622
+12.984
27.84%
jan 1, 1991
50.061
-9.562
-16.04%
jan 1, 1992
1.83
-48.231
-96.34%
jan 1, 1993
2.514
+0.684
37.4%
jan 1, 1994
2.218
-0.296
-11.78%
jan 1, 1995
2.199
-0.019
-0.88%
jan 1, 1996
2.434
+0.235
10.69%
jan 1, 1997
3.587
+1.153
47.38%
jan 1, 1998
22.581
+18.994
529.55%
jan 1, 1999
26.987
+4.406
19.51%
jan 1, 2000
64.117
+37.13
137.58%
jan 1, 2001
100.0
+35.883
55.97%
jan 1, 2002
63.16
-36.84
-36.84%
jan 1, 2003
59.956
-3.204
-5.07%
jan 1, 2004
47.65
-12.306
-20.53%
jan 1, 2005
87.39
+39.74
83.4%
jan 1, 2006
116.276
+28.886
33.05%
jan 1, 2007
144.067
+27.791
23.9%
jan 1, 2008
202.492
+58.425
40.55%
jan 1, 2009
300.654
+98.162
48.48%
jan 1, 2010
205.734
-94.92
-31.57%
jan 1, 2011
257.52
+51.786
25.17%
jan 1, 2012
408.37
+150.85
58.58%
jan 1, 2013
463.158
+54.788
13.42%
jan 1, 2014
440.343
-22.815
-4.93%
jan 1, 2015
436.547
-3.796
-0.86%
jan 1, 2016
242.001
-194.546
-44.56%
Ranking of countries by current statistics by years


Comments: