29
/
en
AIzaSyAYiBZKx7MnpbEhh9jyipgxe19OcubqV5w
April 1, 2024
176312
Lebanon
LBN
true
2
1
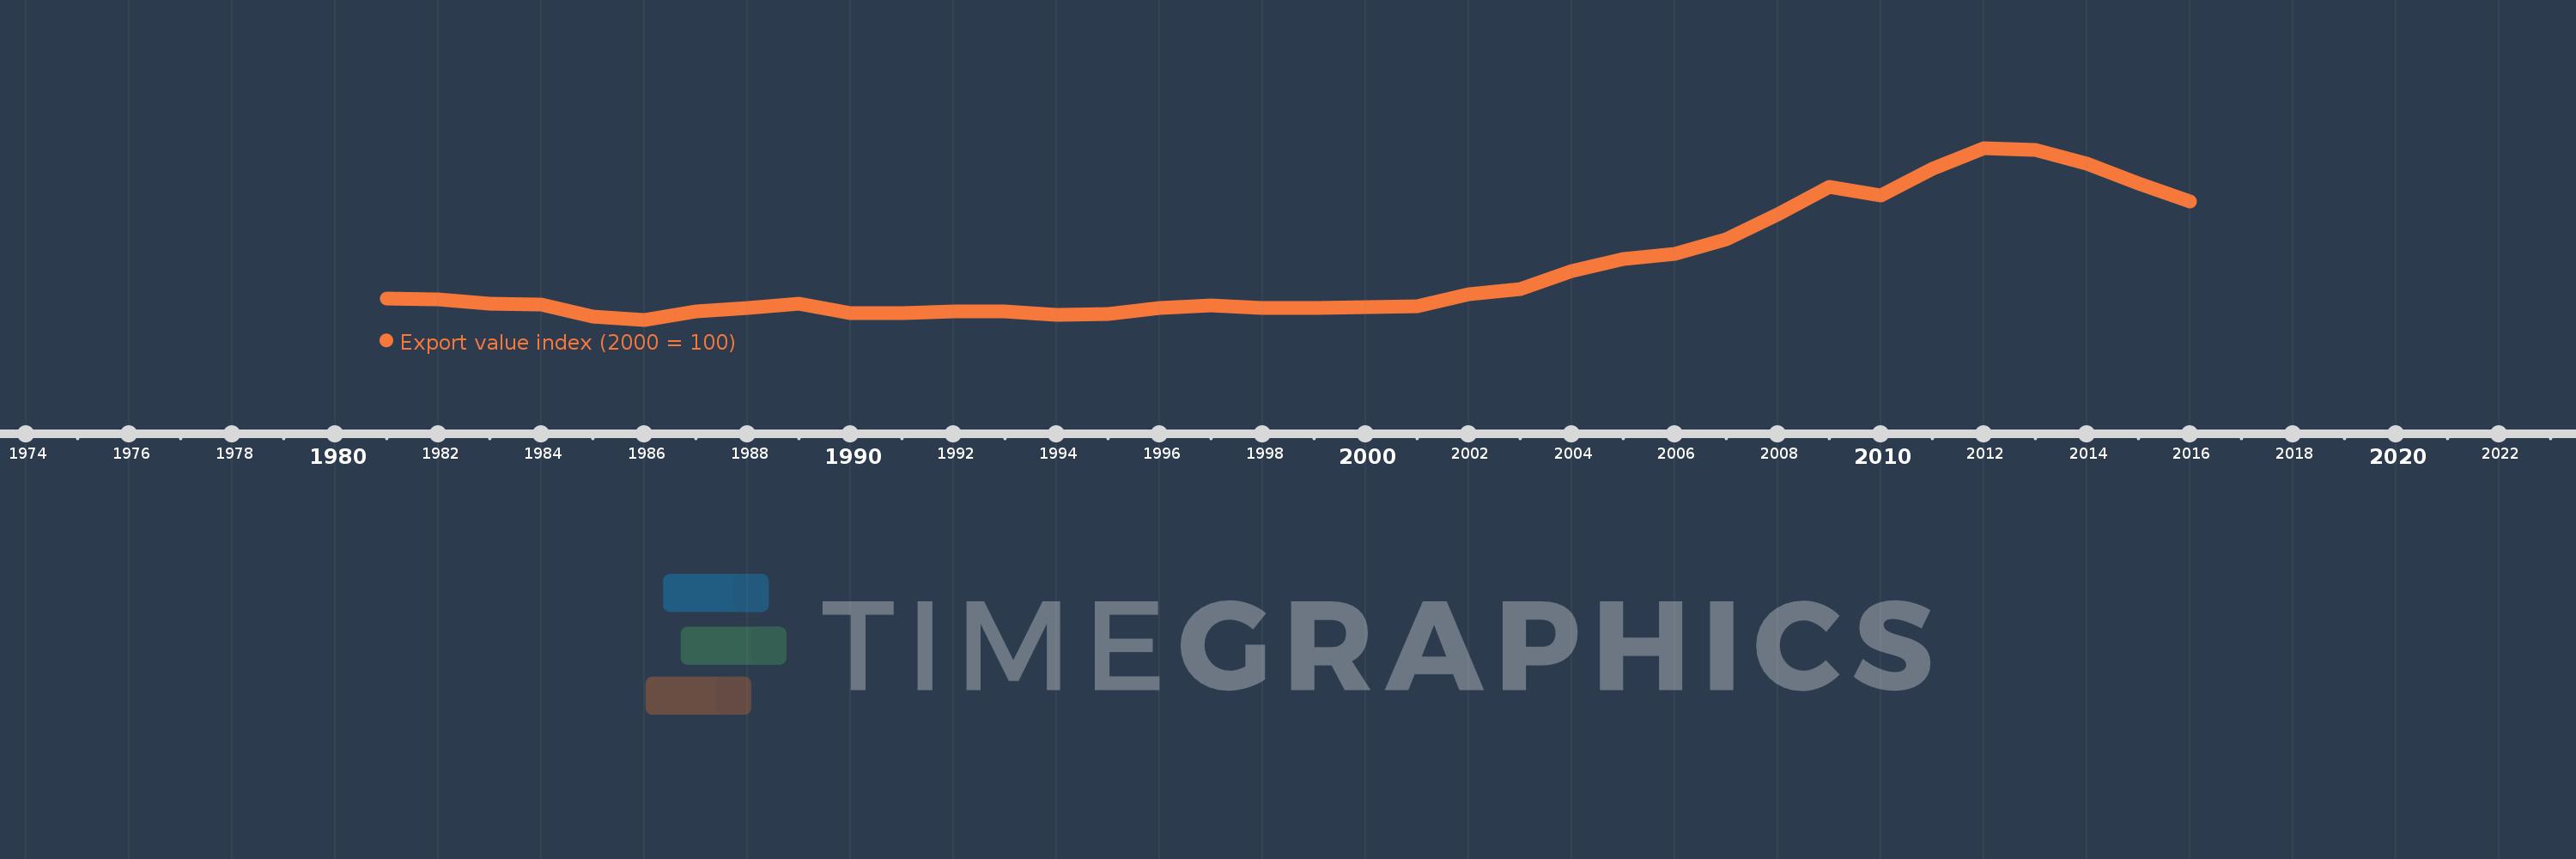
Export value index (2000 = 100)
2016,2015,2014,2013,2012,2011,2010,2009,2008,2007,2006,2005,2004,2003,2002,2001,2000,1999,1998,1997,1996,1995,1994,1993,1992,1991,1990,1989,1988,1987,1986,1985,1984,1983,1982,1981
This statistics in other country:
AfghanistanAlbaniaAlgeriaAmerican SamoaAndorraAngolaAntigua and BarbudaArgentinaArmeniaArubaAustraliaAustriaAzerbaijanBahamas, TheBahrainBangladeshBarbadosBelarusBelgiumBelizeBeninBermudaBhutanBoliviaBosnia and HerzegovinaBotswanaBrazilBritish Virgin IslandsBrunei DarussalamBulgariaBurkina FasoBurundiCabo VerdeCambodiaCameroonCanadaCayman IslandsCentral African RepublicChadChileChinaColombiaComorosCongo, Dem. Rep.Congo, Rep.Costa RicaCote d'IvoireCroatiaCubaCuracaoCyprusCzech RepublicDenmarkDjiboutiDominicaDominican RepublicEcuadorEgypt, Arab Rep.El SalvadorEquatorial GuineaEritreaEstoniaEthiopiaFaroe IslandsFijiFinlandFranceFrench PolynesiaGabonGambia, TheGeorgiaGermanyGhanaGibraltarGreeceGreenlandGrenadaGuamGuatemalaGuineaGuinea-BissauGuyanaHaitiHondurasHong Kong SAR, ChinaHungaryIcelandIndiaIndonesiaIran, Islamic Rep.IraqIrelandIsraelItalyJamaicaJapanJordanKazakhstanKenyaKiribatiKorea, Dem. People’s Rep.Korea, Rep.KuwaitKyrgyz RepublicLao PDRLatviaLebanonLesothoLiberiaLibyaLithuaniaLuxembourgMacao SAR, ChinaMacedonia, FYRMadagascarMalawiMalaysiaMaldivesMaliMaltaMarshall IslandsMauritaniaMauritiusMexicoMicronesia, Fed. Sts.MoldovaMongoliaMoroccoMozambiqueMyanmarNamibiaNauruNepalNetherlandsNew CaledoniaNew ZealandNicaraguaNigerNigeriaNorthern Mariana IslandsNorwayOmanPakistanPalauPanamaPapua New GuineaParaguayPeruPhilippinesPolandPortugalQatarRomaniaRussian FederationRwandaSamoaSao Tome and PrincipeSaudi ArabiaSenegalSerbiaSeychellesSierra LeoneSingaporeSlovak RepublicSloveniaSolomon IslandsSomaliaSouth AfricaSpainSri LankaSt. Kitts and NevisSt. LuciaSt. Vincent and the GrenadinesSudanSurinameSwazilandSwedenSwitzerlandSyrian Arab RepublicTajikistanTanzaniaThailandTogoTongaTrinidad and TobagoTunisiaTurkeyTurkmenistanTurks and Caicos IslandsUgandaUkraineUnited Arab EmiratesUnited KingdomUnited StatesUruguayUzbekistanVanuatuVenezuela, RBVietnamWest Bank and GazaYemen, Rep.ZambiaZimbabwe Timeline:
This timeline shows a graph from 1981 to 2016 of Lebanon. No data until 1980. Number of actual observations by date: 36.
Source name:
World Development Indicators
Source organization:
United Nations Conference on Trade and Development, Handbook of Statistics and data files, and International Monetary Fund, International Financial Statistics.
Categories, topics:
Private Sector, Trade
Last updated:
apr 23, 2017
Indicators value changes by year
Minimum:
40.303
jan 1, 1986
Maximum:
792.633
jan 1, 2012
At the date of observation
Value
Absolute change
Change from previous value
jan 1, 1981
133.645
+133.645
0.0%
jan 1, 1982
128.747
-4.898
-3.66%
jan 1, 1983
111.954
-16.793
-13.04%
jan 1, 1984
106.356
-5.598
-5.0%
jan 1, 1985
52.916
-53.441
-50.25%
jan 1, 1986
40.303
-12.613
-23.84%
jan 1, 1987
76.968
+36.666
90.98%
jan 1, 1988
90.963
+13.994
18.18%
jan 1, 1989
109.155
+18.193
20.0%
jan 1, 1990
67.914
-41.241
-37.78%
jan 1, 1991
69.132
+1.217
1.79%
jan 1, 1992
75.443
+6.311
9.13%
jan 1, 1993
78.326
+2.883
3.82%
jan 1, 1994
63.235
-15.091
-19.27%
jan 1, 1995
65.829
+2.594
4.1%
jan 1, 1996
91.77
+25.941
39.41%
jan 1, 1997
103.053
+11.283
12.29%
jan 1, 1998
89.991
-13.061
-12.67%
jan 1, 1999
92.599
+2.608
2.9%
jan 1, 2000
94.72
+2.121
2.29%
jan 1, 2001
100.0
+5.28
5.57%
jan 1, 2002
152.957
+52.957
52.96%
jan 1, 2003
173.249
+20.292
13.27%
jan 1, 2004
253.715
+80.467
46.45%
jan 1, 2005
307.733
+54.018
21.29%
jan 1, 2006
327.045
+19.312
6.28%
jan 1, 2007
393.798
+66.752
20.41%
jan 1, 2008
500.154
+106.356
27.01%
jan 1, 2009
623.303
+123.149
24.62%
jan 1, 2010
585.939
-37.365
-5.99%
jan 1, 2011
702.651
+116.712
19.92%
jan 1, 2012
792.633
+89.983
12.81%
jan 1, 2013
785.776
-6.857
-0.87%
jan 1, 2014
723.458
-62.318
-7.93%
jan 1, 2015
636.458
-87.0
-12.03%
jan 1, 2016
557.186
-79.272
-12.46%
Ranking of countries by current statistics by years


Comments: