29
/
en
AIzaSyAYiBZKx7MnpbEhh9jyipgxe19OcubqV5w
April 1, 2024
124721
Egypt, Arab Rep.
EGY
true
2
1
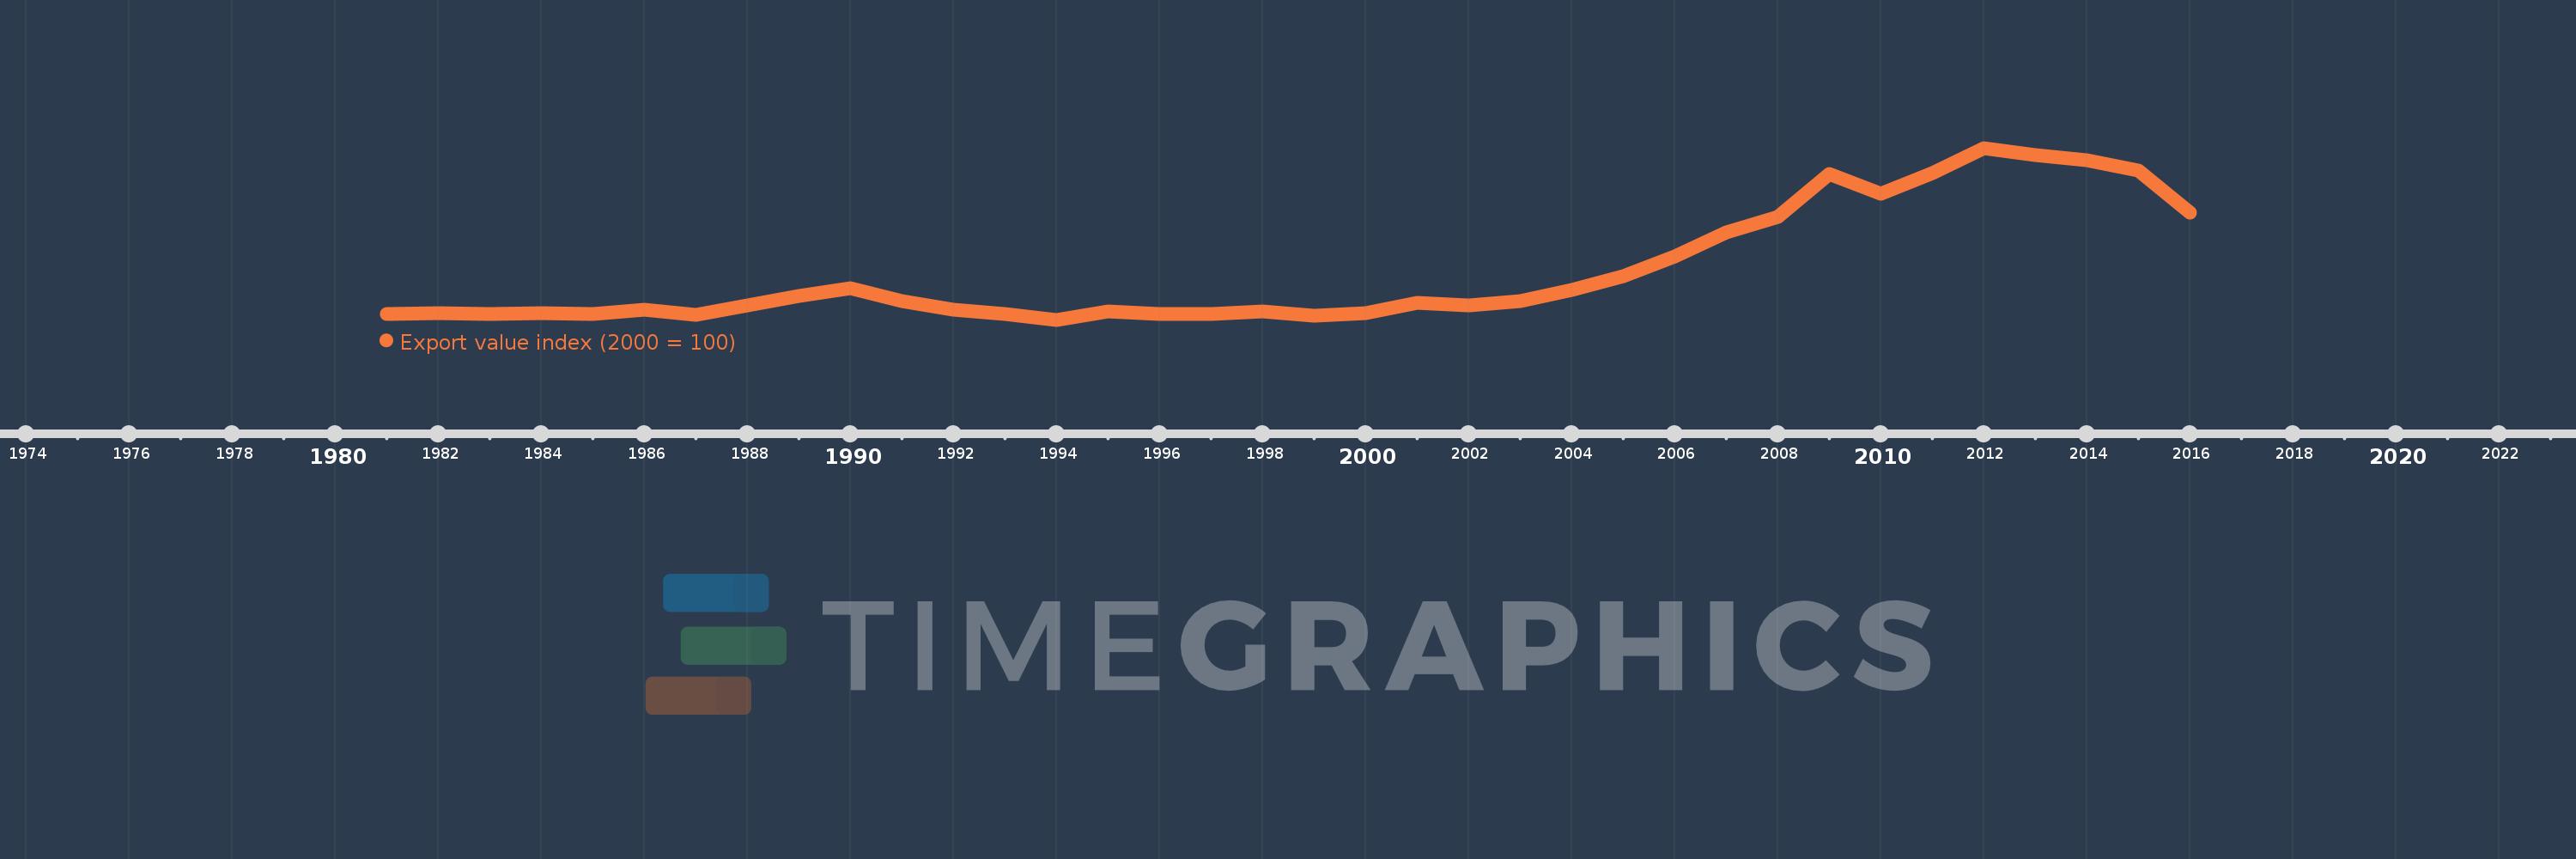
Export value index (2000 = 100)
2016,2015,2014,2013,2012,2011,2010,2009,2008,2007,2006,2005,2004,2003,2002,2001,2000,1999,1998,1997,1996,1995,1994,1993,1992,1991,1990,1989,1988,1987,1986,1985,1984,1983,1982,1981
This statistics in other country:
AfghanistanAlbaniaAlgeriaAmerican SamoaAndorraAngolaAntigua and BarbudaArgentinaArmeniaArubaAustraliaAustriaAzerbaijanBahamas, TheBahrainBangladeshBarbadosBelarusBelgiumBelizeBeninBermudaBhutanBoliviaBosnia and HerzegovinaBotswanaBrazilBritish Virgin IslandsBrunei DarussalamBulgariaBurkina FasoBurundiCabo VerdeCambodiaCameroonCanadaCayman IslandsCentral African RepublicChadChileChinaColombiaComorosCongo, Dem. Rep.Congo, Rep.Costa RicaCote d'IvoireCroatiaCubaCuracaoCyprusCzech RepublicDenmarkDjiboutiDominicaDominican RepublicEcuadorEgypt, Arab Rep.El SalvadorEquatorial GuineaEritreaEstoniaEthiopiaFaroe IslandsFijiFinlandFranceFrench PolynesiaGabonGambia, TheGeorgiaGermanyGhanaGibraltarGreeceGreenlandGrenadaGuamGuatemalaGuineaGuinea-BissauGuyanaHaitiHondurasHong Kong SAR, ChinaHungaryIcelandIndiaIndonesiaIran, Islamic Rep.IraqIrelandIsraelItalyJamaicaJapanJordanKazakhstanKenyaKiribatiKorea, Dem. People’s Rep.Korea, Rep.KuwaitKyrgyz RepublicLao PDRLatviaLebanonLesothoLiberiaLibyaLithuaniaLuxembourgMacao SAR, ChinaMacedonia, FYRMadagascarMalawiMalaysiaMaldivesMaliMaltaMarshall IslandsMauritaniaMauritiusMexicoMicronesia, Fed. Sts.MoldovaMongoliaMoroccoMozambiqueMyanmarNamibiaNauruNepalNetherlandsNew CaledoniaNew ZealandNicaraguaNigerNigeriaNorthern Mariana IslandsNorwayOmanPakistanPalauPanamaPapua New GuineaParaguayPeruPhilippinesPolandPortugalQatarRomaniaRussian FederationRwandaSamoaSao Tome and PrincipeSaudi ArabiaSenegalSerbiaSeychellesSierra LeoneSingaporeSlovak RepublicSloveniaSolomon IslandsSomaliaSouth AfricaSpainSri LankaSt. Kitts and NevisSt. LuciaSt. Vincent and the GrenadinesSudanSurinameSwazilandSwedenSwitzerlandSyrian Arab RepublicTajikistanTanzaniaThailandTogoTongaTrinidad and TobagoTunisiaTurkeyTurkmenistanTurks and Caicos IslandsUgandaUkraineUnited Arab EmiratesUnited KingdomUnited StatesUruguayUzbekistanVanuatuVenezuela, RBVietnamWest Bank and GazaYemen, Rep.ZambiaZimbabwe Timeline:
This timeline shows a graph from 1981 to 2016 of Egypt, Arab Rep.. No data until 1980. Number of actual observations by date: 36.
Source name:
World Development Indicators
Source organization:
United Nations Conference on Trade and Development, Handbook of Statistics and data files, and International Monetary Fund, International Financial Statistics.
Categories, topics:
Private Sector, Trade
Last updated:
apr 23, 2017
Indicators value changes by year
Minimum:
48.025
jan 1, 1994
Maximum:
578.616
jan 1, 2012
At the date of observation
Value
Absolute change
Change from previous value
jan 1, 1981
64.959
+64.959
0.0%
jan 1, 1982
68.944
+3.985
6.13%
jan 1, 1983
66.542
-2.402
-3.48%
jan 1, 1984
68.55
+2.009
3.02%
jan 1, 1985
66.962
-1.589
-2.32%
jan 1, 1986
79.209
+12.248
18.29%
jan 1, 1987
62.575
-16.634
-21.0%
jan 1, 1988
92.799
+30.224
48.3%
jan 1, 1989
121.692
+28.893
31.14%
jan 1, 1990
144.259
+22.567
18.54%
jan 1, 1991
105.706
-38.554
-26.73%
jan 1, 1992
79.022
-26.684
-25.24%
jan 1, 1993
65.322
-13.7
-17.34%
jan 1, 1994
48.025
-17.297
-26.48%
jan 1, 1995
74.12
+26.095
54.34%
jan 1, 1996
65.101
-9.019
-12.17%
jan 1, 1997
66.992
+1.892
2.91%
jan 1, 1998
74.31
+7.318
10.92%
jan 1, 1999
59.334
-14.977
-20.15%
jan 1, 2000
67.463
+8.13
13.7%
jan 1, 2001
100.0
+32.537
48.23%
jan 1, 2002
91.443
-8.557
-8.56%
jan 1, 2003
105.116
+13.673
14.95%
jan 1, 2004
140.405
+35.289
33.57%
jan 1, 2005
183.12
+42.715
30.42%
jan 1, 2006
244.732
+61.612
33.65%
jan 1, 2007
317.061
+72.329
29.55%
jan 1, 2008
364.368
+47.307
14.92%
jan 1, 2009
497.04
+132.672
36.41%
jan 1, 2010
437.105
-59.935
-12.06%
jan 1, 2011
501.097
+63.992
14.64%
jan 1, 2012
578.616
+77.519
15.47%
jan 1, 2013
557.416
-21.2
-3.66%
jan 1, 2014
540.05
-17.365
-3.12%
jan 1, 2015
508.949
-31.101
-5.76%
jan 1, 2016
380.037
-128.912
-25.33%
Ranking of countries by current statistics by years


Comments: