29
/
en
AIzaSyAYiBZKx7MnpbEhh9jyipgxe19OcubqV5w
April 1, 2024
170604
Korea, Rep.
KOR
true
2
1
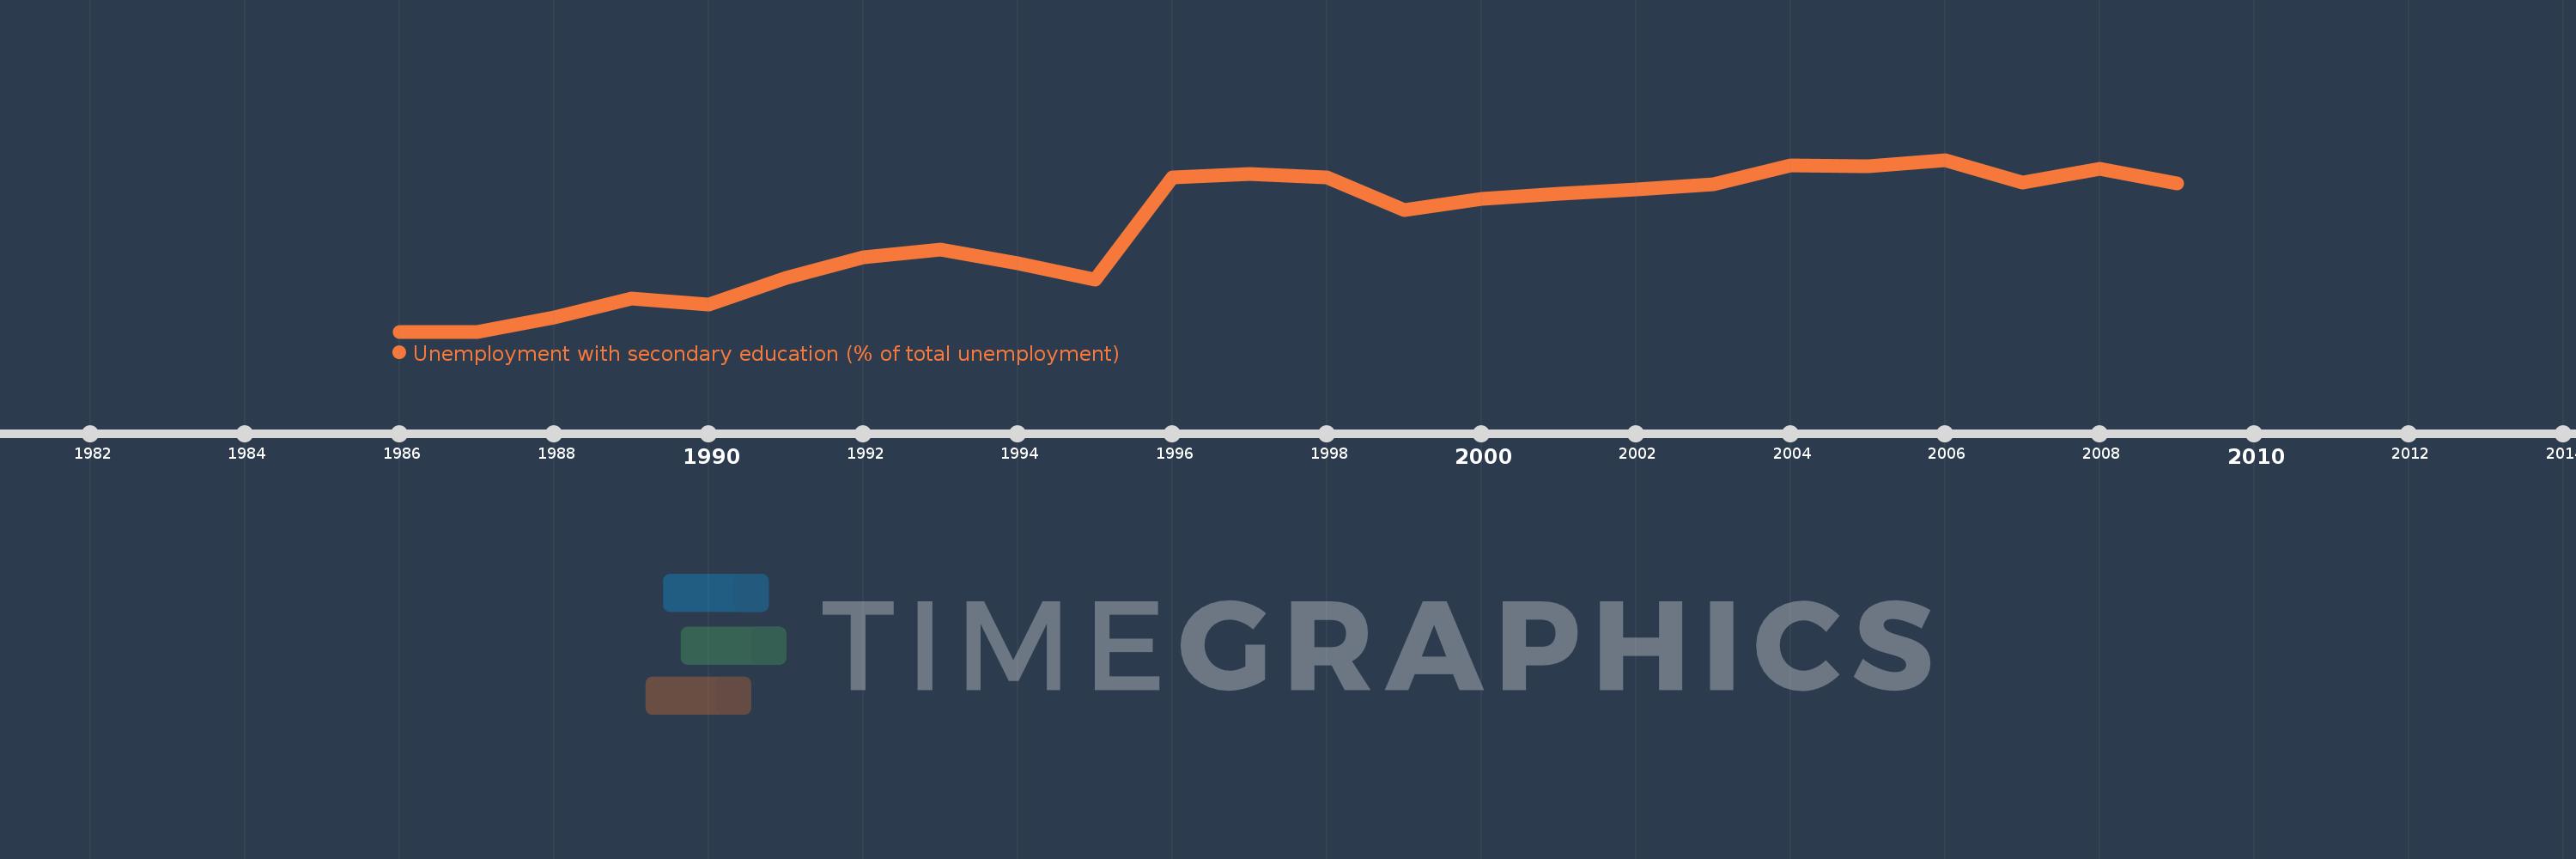
Unemployment with secondary education (% of total unemployment)
2009,2008,2007,2006,2005,2004,2003,2002,2001,2000,1999,1998,1997,1996,1995,1994,1993,1992,1991,1990,1989,1988,1987,1986
This statistics in other country:
Timeline:
This timeline shows a graph from 1986 to 2009 of Korea, Rep.. No data until 1985. Number of actual observations by date: 24.
Source name:
World Development Indicators
Source organization:
International Labour Organization, Key Indicators of the Labour Market database.
Categories, topics:
Social Protection & Labor
Last updated:
apr 23, 2017
Indicators value changes by year
At the date of observation
Value
Absolute change
Change from previous value
jan 1, 1986
46.8
+46.8
0.0%
jan 1, 1988
48.4
+1.6
3.42%
jan 1, 1989
50.6
+2.2
4.55%
jan 1, 1990
49.9
-0.7
-1.38%
jan 1, 1991
52.9
+3.0
6.01%
jan 1, 1992
55.3
+2.4
4.54%
jan 1, 1993
56.2
+0.9
1.63%
jan 1, 1994
54.6
-1.6
-2.85%
jan 1, 1995
52.7
-1.9
-3.48%
jan 1, 1996
64.4
+11.7
22.2%
jan 1, 1997
64.8
+0.4
0.62%
jan 1, 1998
64.4
-0.4
-0.62%
jan 1, 1999
60.7
-3.7
-5.75%
jan 1, 2000
61.9
+1.2
1.98%
jan 1, 2001
62.5
+0.6
0.97%
jan 1, 2002
63.0
+0.5
0.8%
jan 1, 2003
63.6
+0.6
0.95%
jan 1, 2004
65.8
+2.2
3.46%
jan 1, 2005
65.7
-0.1
-0.15%
jan 1, 2006
66.4
+0.7
1.07%
jan 1, 2007
63.8
-2.6
-3.92%
jan 1, 2008
65.4
+1.6
2.51%
jan 1, 2009
63.7
-1.7
-2.6%
Ranking of countries by current statistics by years


Comments: