29
/
en
AIzaSyAYiBZKx7MnpbEhh9jyipgxe19OcubqV5w
April 1, 2024
252590
St. Vincent and the Grenadines
VCT
true
2
1
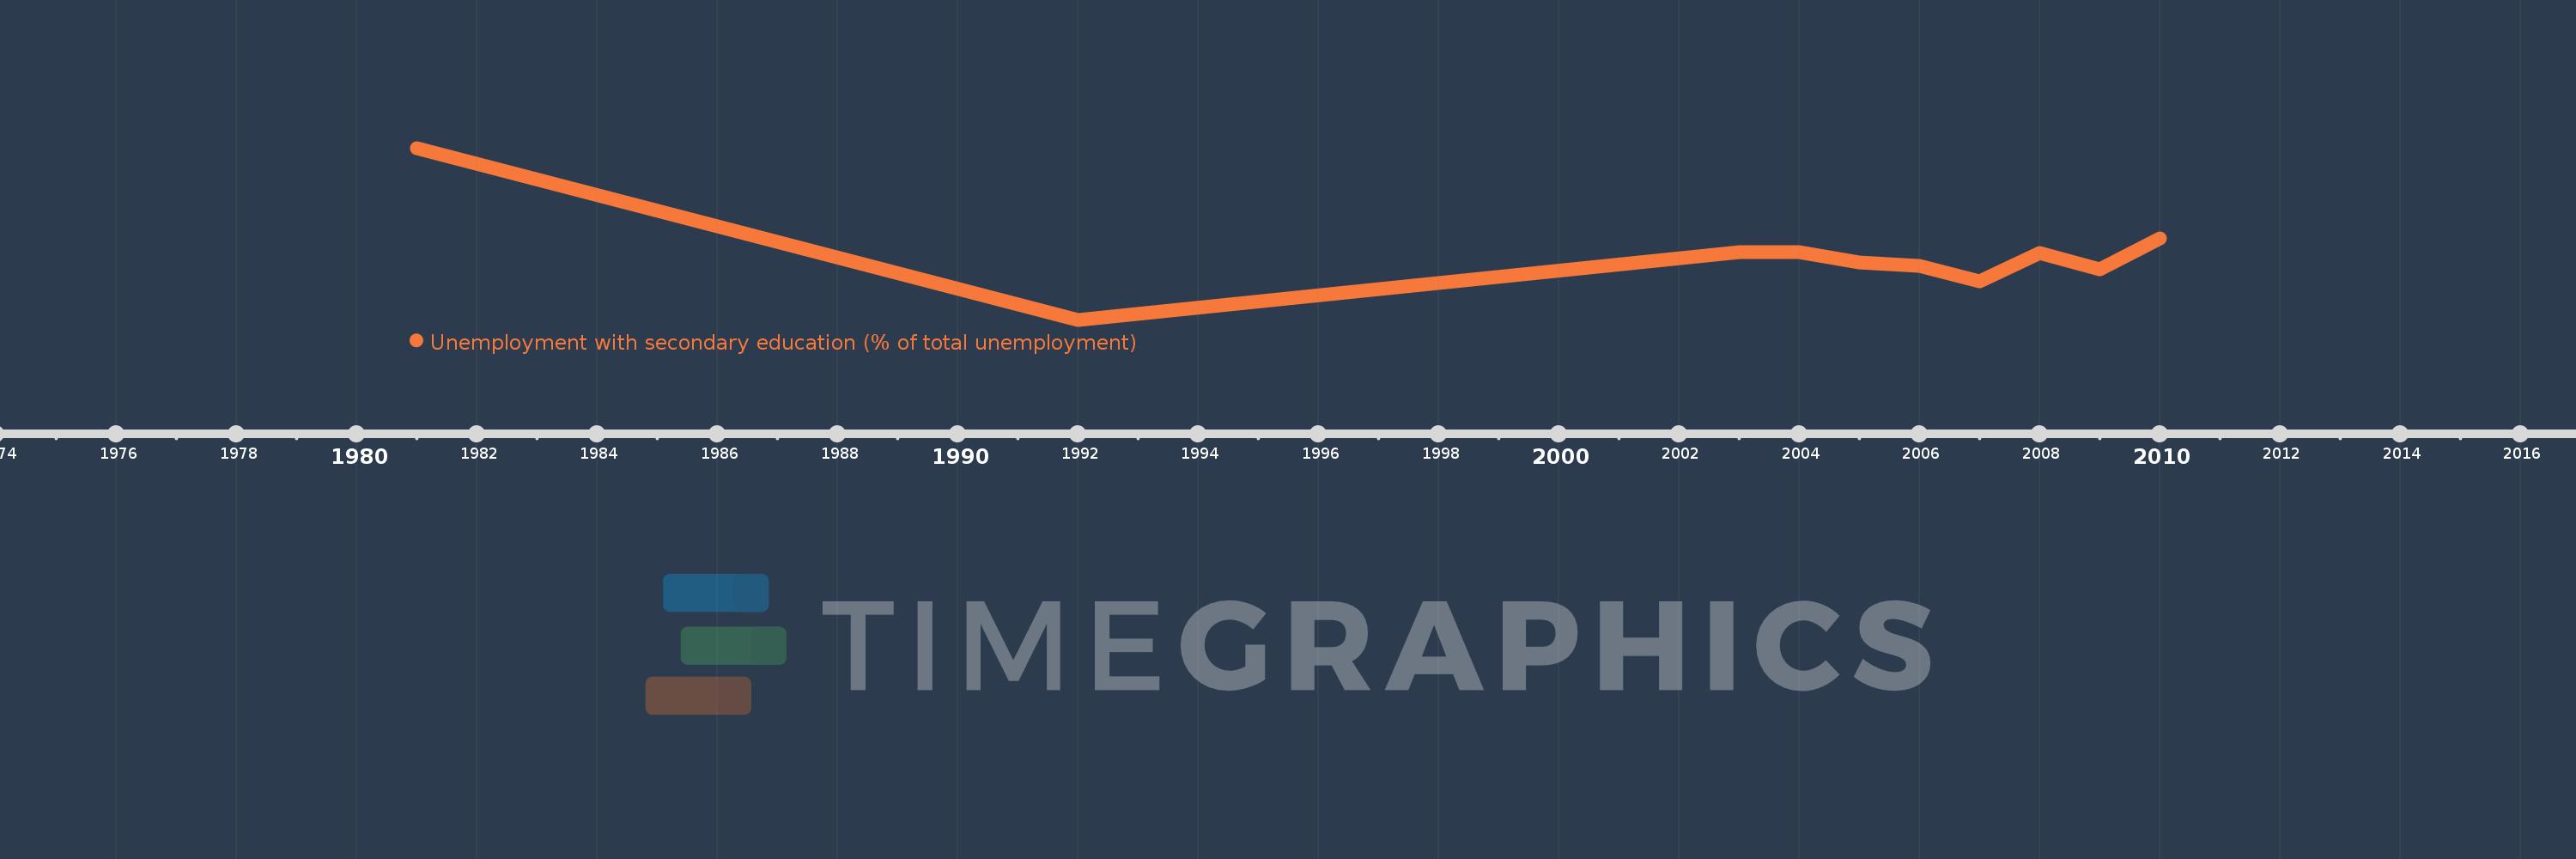
Unemployment with secondary education (% of total unemployment)
2010,2009,2008,2007,2006,2005,2004,2003,1992,1981
This statistics in other country:
Timeline:
This timeline shows a graph from 1981 to 2010 of St. Vincent and the Grenadines. No data until 1980. Number of actual observations by date: 10.
Source name:
World Development Indicators
Source organization:
International Labour Organization, Key Indicators of the Labour Market database.
Categories, topics:
Social Protection & Labor
Last updated:
apr 23, 2017
Indicators value changes by year
At the date of observation
Value
Absolute change
Change from previous value
jan 1, 1981
96.5
+96.5
0.0%
jan 1, 1992
24.4
-72.1
-74.72%
jan 1, 2003
52.7
+28.3
115.98%
jan 1, 2004
52.8
+0.1
0.19%
jan 1, 2005
48.3
-4.5
-8.52%
jan 1, 2006
47.1
-1.2
-2.48%
jan 1, 2007
40.4
-6.7
-14.23%
jan 1, 2008
52.4
+12.0
29.7%
jan 1, 2009
45.4
-7.0
-13.36%
jan 1, 2010
58.7
+13.3
29.3%
Ranking of countries by current statistics by years


Comments: