29
/
en
AIzaSyAYiBZKx7MnpbEhh9jyipgxe19OcubqV5w
April 1, 2024
33144
Europe & Central Asia (IDA & IBRD countries)
TEC
false
2
1
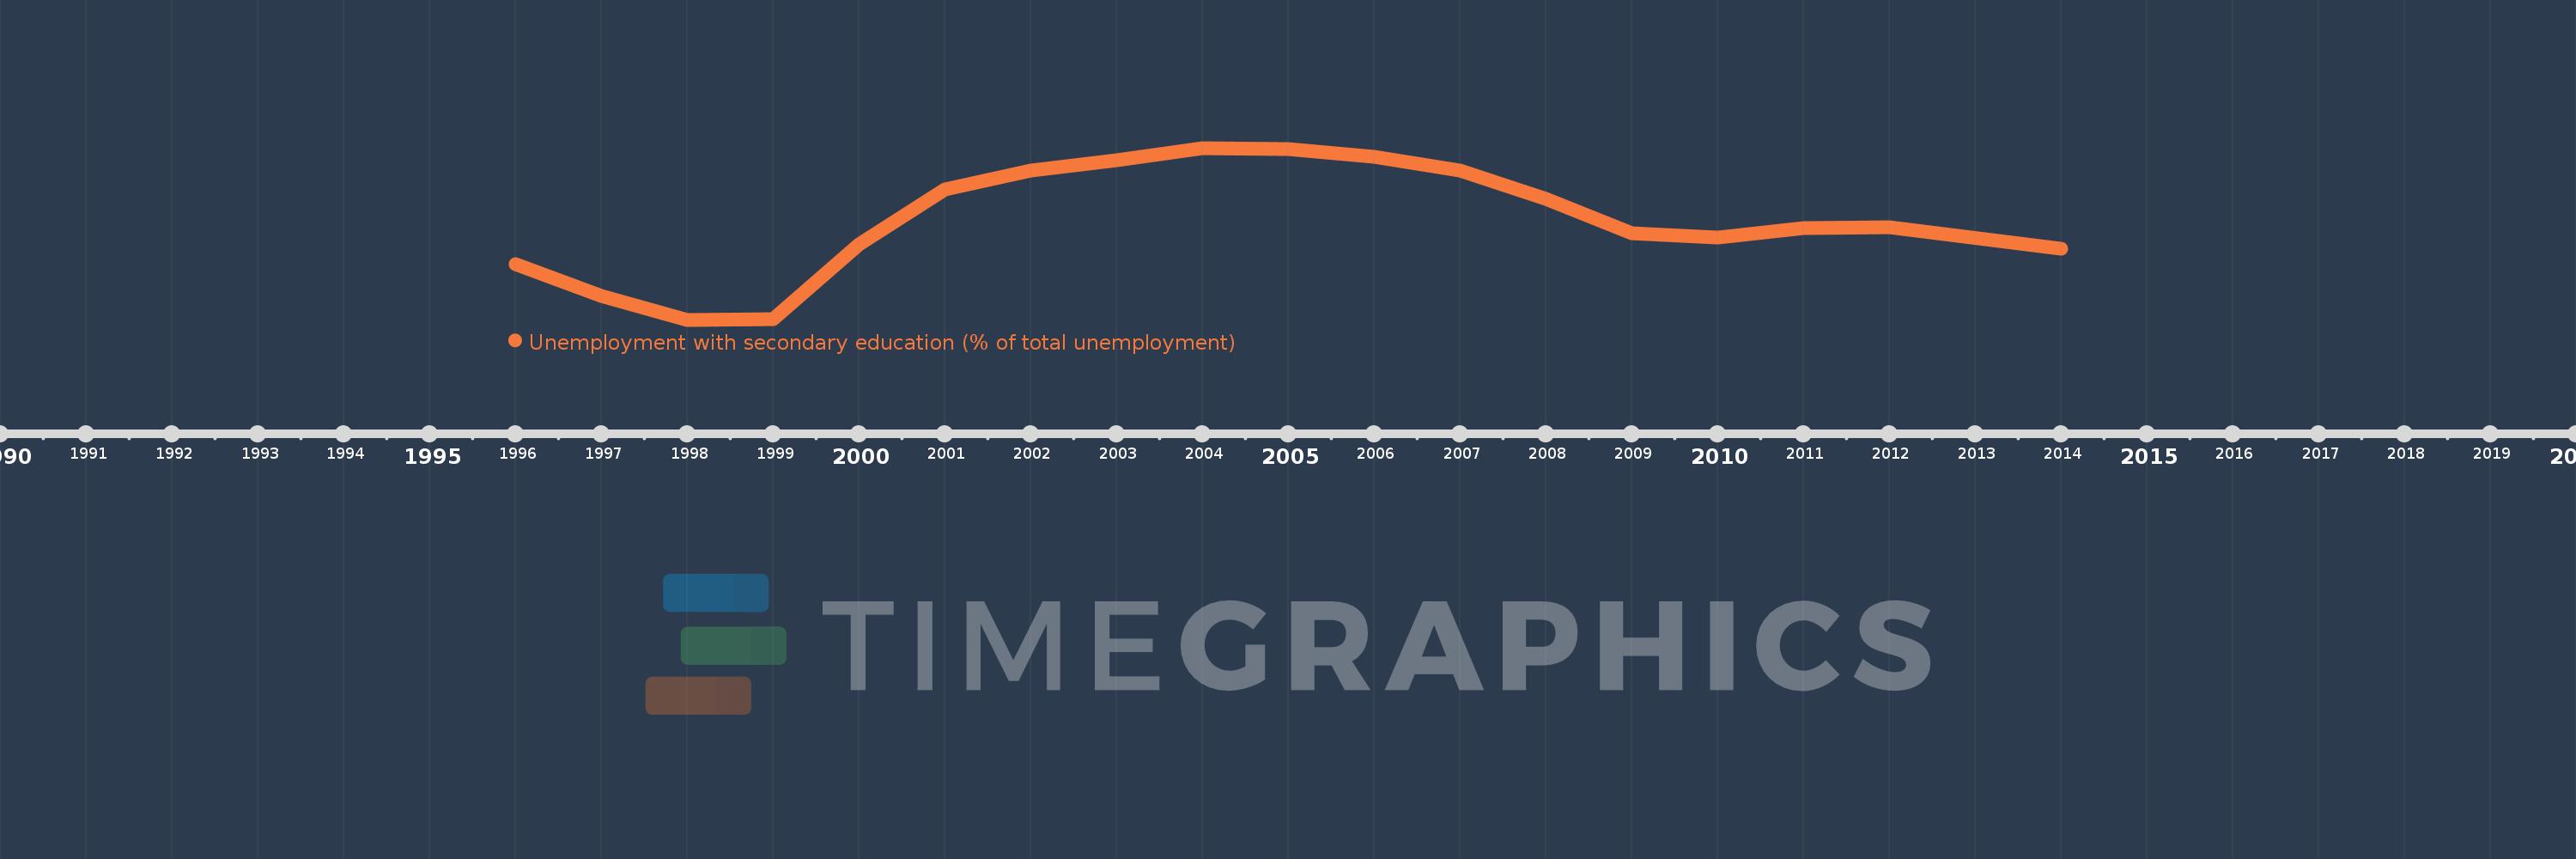
Unemployment with secondary education (% of total unemployment)
2014,2012,2011,2010,2009,2008,2007,2006,2005,2004,2003,2002,2001,2000,1999,1998,1997,1996
This statistics in other country:
Timeline:
This timeline shows a graph from 1996 to 2014 of Europe & Central Asia (IDA & IBRD countries). No data until 1995. Number of actual observations by date: 18.
Source name:
World Development Indicators
Source organization:
International Labour Organization, Key Indicators of the Labour Market database.
Categories, topics:
Social Protection & Labor
Last updated:
apr 23, 2017
Indicators value changes by year
Maximum:
55.267
jan 1, 2004
At the date of observation
Value
Absolute change
Change from previous value
jan 1, 1996
48.643
+48.643
0.0%
jan 1, 1997
46.849
-1.794
-3.69%
jan 1, 1998
45.48
-1.369
-2.92%
jan 1, 1999
45.536
+0.056
0.12%
jan 1, 2000
49.781
+4.245
9.32%
jan 1, 2001
52.921
+3.14
6.31%
jan 1, 2002
53.961
+1.04
1.97%
jan 1, 2003
54.561
+0.6
1.11%
jan 1, 2004
55.267
+0.705
1.29%
jan 1, 2005
55.183
-0.084
-0.15%
jan 1, 2006
54.777
-0.405
-0.73%
jan 1, 2007
53.999
-0.778
-1.42%
jan 1, 2008
52.36
-1.638
-3.03%
jan 1, 2009
50.402
-1.959
-3.74%
jan 1, 2010
50.166
-0.236
-0.47%
jan 1, 2011
50.711
+0.545
1.09%
jan 1, 2012
50.726
+0.015
0.03%
jan 1, 2014
49.532
-1.194
-2.35%
Ranking of countries by current statistics by years


Comments: