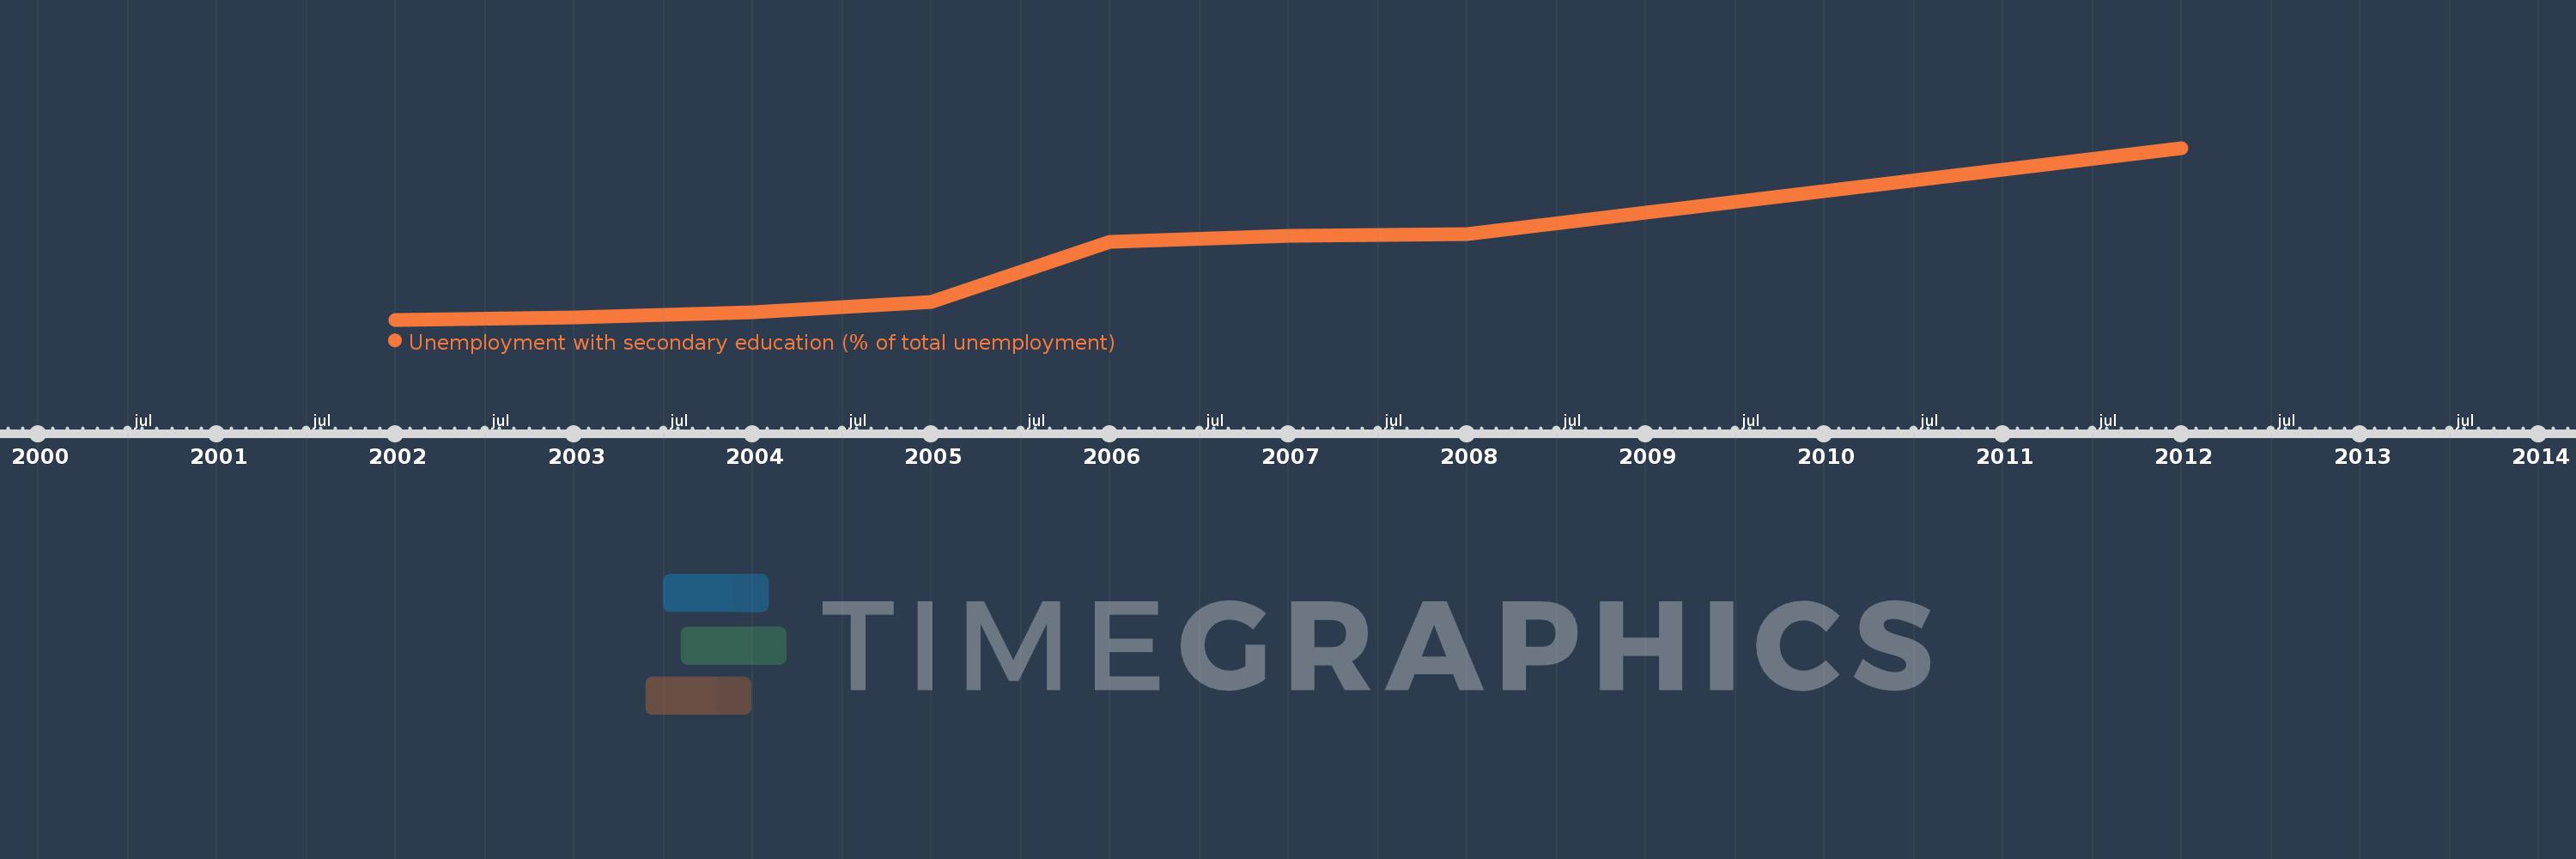
This timeline shows a graph from 2002 to 2012 of Latin America & Caribbean (excluding high income). No data until 2001. Number of actual observations by date: 8.
Source name:
World Development Indicators
Source organization:
International Labour Organization, Key Indicators of the Labour Market database.
Categories, topics:
Social Protection & Labor
Last updated:
apr 23, 2017
Indicators value changes by year
Meaning:
34.506
Minimum:
27.951
jan 1, 2002
Maximum:
48.087
jan 1, 2012
At the date of observation
Value
Absolute change
Change from the previous value
jan 1, 2002
27.951
+27.951
0.0%
jan 1, 2003
28.227
+0.275
0.98%
jan 1, 2004
28.862
+0.635
2.25%
jan 1, 2005
30.021
+1.159
4.01%
jan 1, 2006
37.13
+7.11
23.68%
jan 1, 2007
37.749
+0.618
1.67%
jan 1, 2008
38.024
+0.275
0.73%
jan 1, 2012
48.087
+10.063
26.47%
Ranking of countries by current statistics by years
