29
/
en
AIzaSyAYiBZKx7MnpbEhh9jyipgxe19OcubqV5w
April 1, 2024
26213
Central Europe and the Baltics
CEB
false
2
1
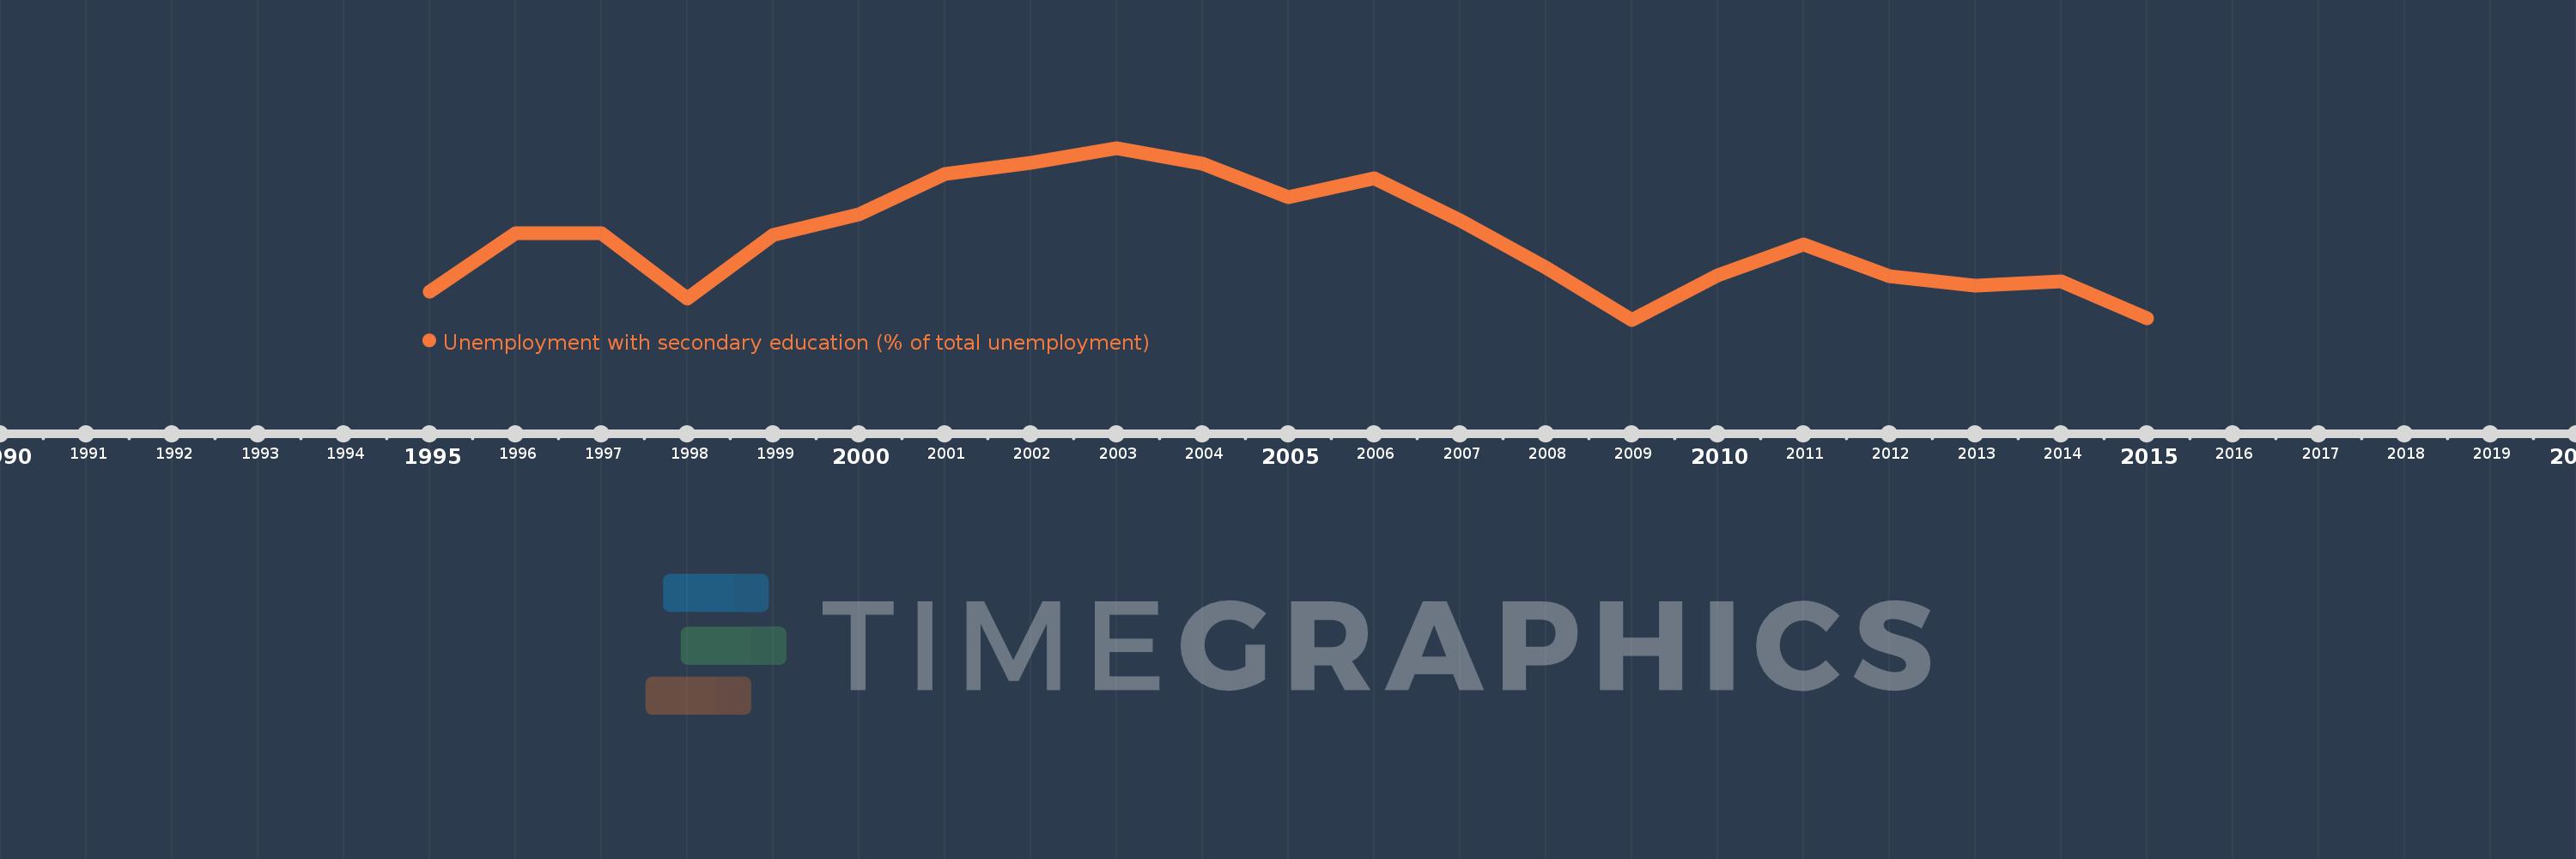
Unemployment with secondary education (% of total unemployment)
2015,2014,2013,2012,2011,2010,2009,2008,2007,2006,2005,2004,2003,2002,2001,2000,1999,1998,1997,1996,1995
This statistics in other country:
Timeline:
This timeline shows a graph from 1995 to 2015 of Central Europe and the Baltics. No data until 1994. Number of actual observations by date: 21.
Source name:
World Development Indicators
Source organization:
International Labour Organization, Key Indicators of the Labour Market database.
Categories, topics:
Social Protection & Labor
Last updated:
apr 23, 2017
Indicators value changes by year
Minimum:
65.602
jan 1, 2009
Maximum:
71.922
jan 1, 2003
At the date of observation
Value
Absolute change
Change from previous value
jan 1, 1995
66.651
+66.651
0.0%
jan 1, 1996
68.791
+2.14
3.21%
jan 1, 1997
68.776
-0.014
-0.02%
jan 1, 1998
66.397
-2.379
-3.46%
jan 1, 1999
68.714
+2.317
3.49%
jan 1, 2000
69.47
+0.756
1.1%
jan 1, 2001
70.969
+1.499
2.16%
jan 1, 2002
71.39
+0.421
0.59%
jan 1, 2003
71.922
+0.531
0.74%
jan 1, 2004
71.331
-0.591
-0.82%
jan 1, 2005
70.124
-1.206
-1.69%
jan 1, 2006
70.795
+0.671
0.96%
jan 1, 2007
69.244
-1.551
-2.19%
jan 1, 2008
67.523
-1.721
-2.49%
jan 1, 2009
65.602
-1.921
-2.85%
jan 1, 2010
67.251
+1.65
2.51%
jan 1, 2011
68.377
+1.126
1.67%
jan 1, 2012
67.196
-1.181
-1.73%
jan 1, 2013
66.854
-0.342
-0.51%
jan 1, 2014
67.024
+0.171
0.26%
jan 1, 2015
65.661
-1.363
-2.03%
Ranking of countries by current statistics by years


Comments: