29
/
en
AIzaSyAYiBZKx7MnpbEhh9jyipgxe19OcubqV5w
April 1, 2024
53138
OECD members
OED
false
2
1
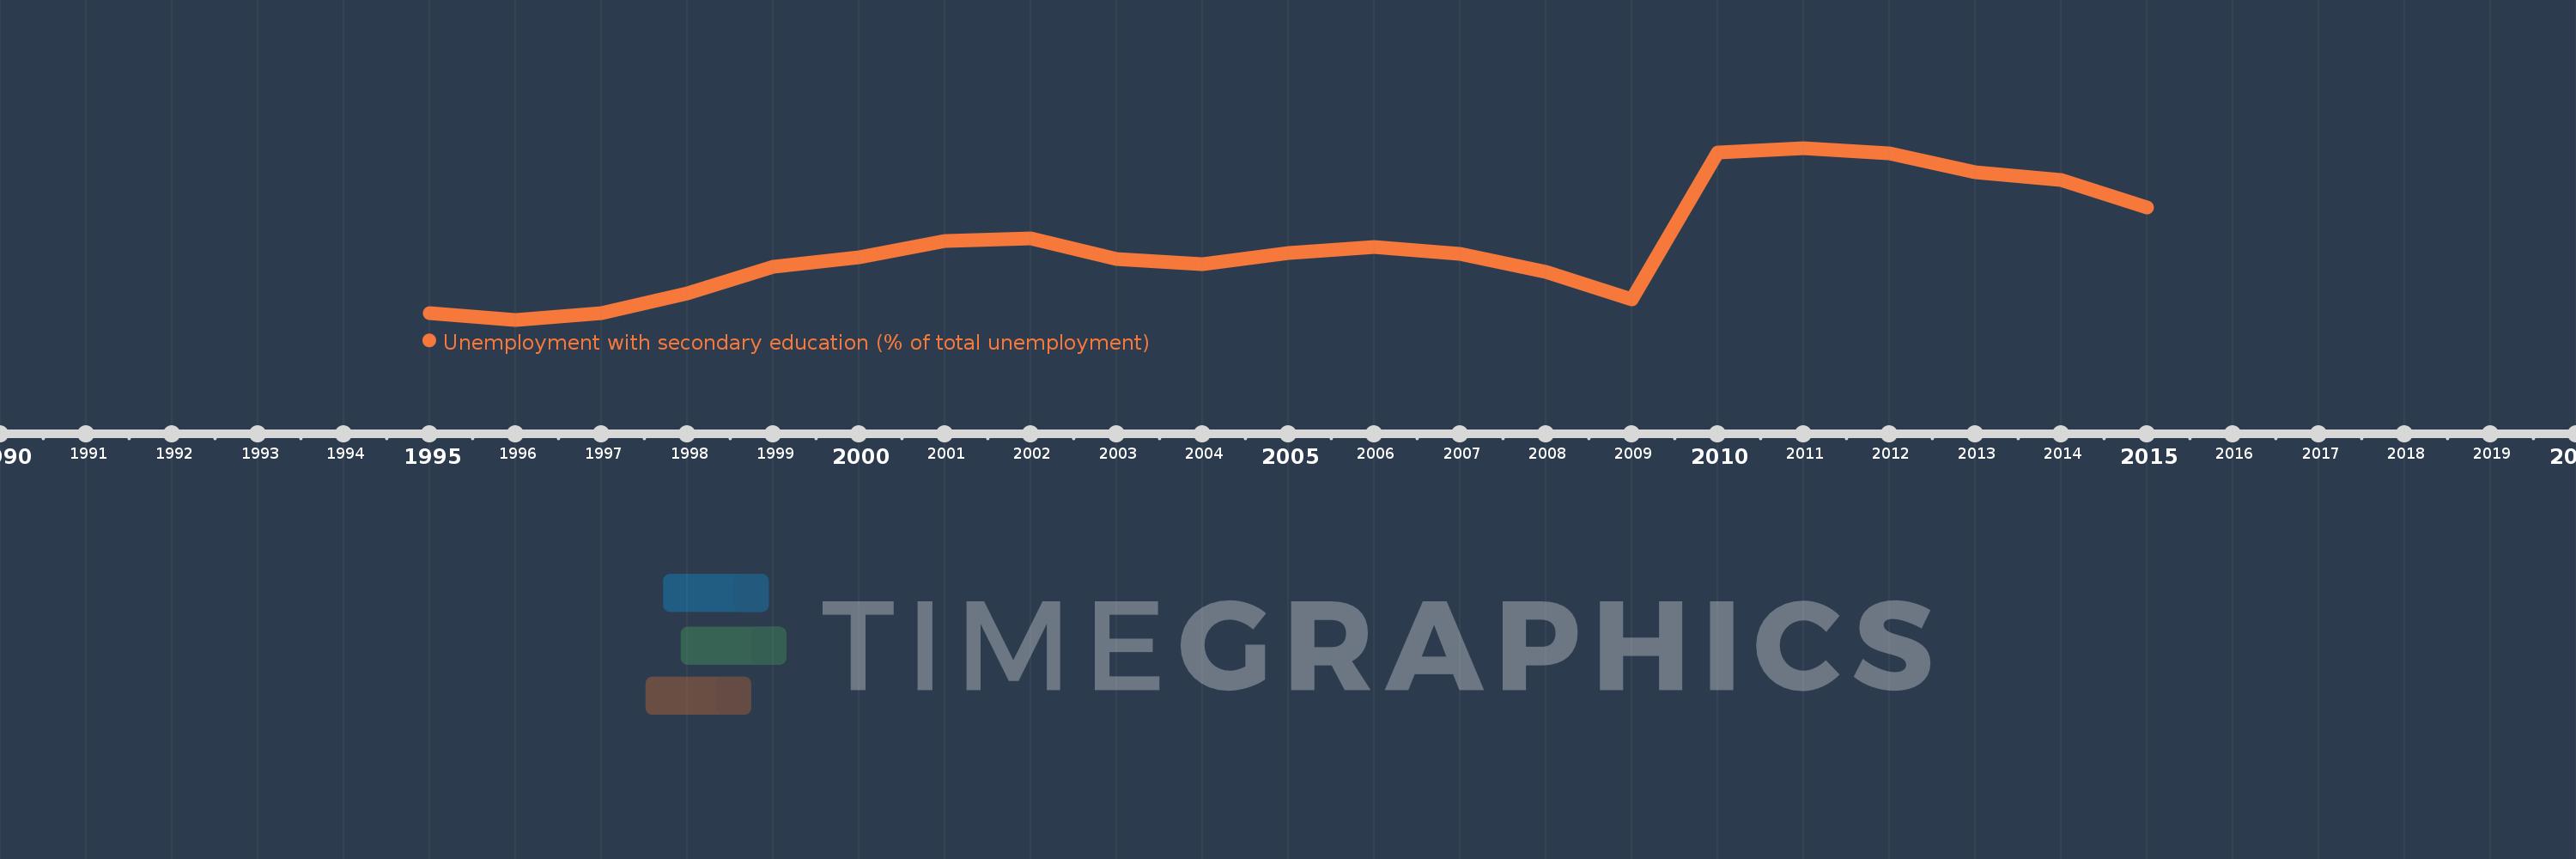
Unemployment with secondary education (% of total unemployment)
2015,2014,2013,2012,2011,2010,2009,2008,2007,2006,2005,2004,2003,2002,2001,2000,1999,1998,1997,1996,1995
This statistics in other country:
Timeline:
This timeline shows a graph from 1995 to 2015 of OECD members. No data until 1994. Number of actual observations by date: 21.
Source name:
World Development Indicators
Source organization:
International Labour Organization, Key Indicators of the Labour Market database.
Categories, topics:
Social Protection & Labor
Last updated:
apr 23, 2017
Indicators value changes by year
Minimum:
39.278
jan 1, 1996
Maximum:
52.616
jan 1, 2011
At the date of observation
Value
Absolute change
Change from previous value
jan 1, 1995
39.799
+39.799
0.0%
jan 1, 1996
39.278
-0.521
-1.31%
jan 1, 1997
39.806
+0.529
1.35%
jan 1, 1998
41.315
+1.508
3.79%
jan 1, 1999
43.392
+2.077
5.03%
jan 1, 2000
44.127
+0.735
1.69%
jan 1, 2001
45.38
+1.253
2.84%
jan 1, 2002
45.564
+0.184
0.41%
jan 1, 2003
43.987
-1.577
-3.46%
jan 1, 2004
43.585
-0.402
-0.91%
jan 1, 2005
44.429
+0.843
1.94%
jan 1, 2006
44.909
+0.48
1.08%
jan 1, 2007
44.404
-0.505
-1.12%
jan 1, 2008
42.968
-1.436
-3.24%
jan 1, 2009
40.879
-2.089
-4.86%
jan 1, 2010
52.245
+11.366
27.8%
jan 1, 2011
52.616
+0.371
0.71%
jan 1, 2012
52.176
-0.44
-0.84%
jan 1, 2013
50.712
-1.464
-2.81%
jan 1, 2014
50.151
-0.561
-1.11%
jan 1, 2015
47.969
-2.183
-4.35%
Ranking of countries by current statistics by years


Comments: