29
/es/
es
AIzaSyAYiBZKx7MnpbEhh9jyipgxe19OcubqV5w
April 1, 2024
170604
Korea, Rep.
KOR
true
2
1
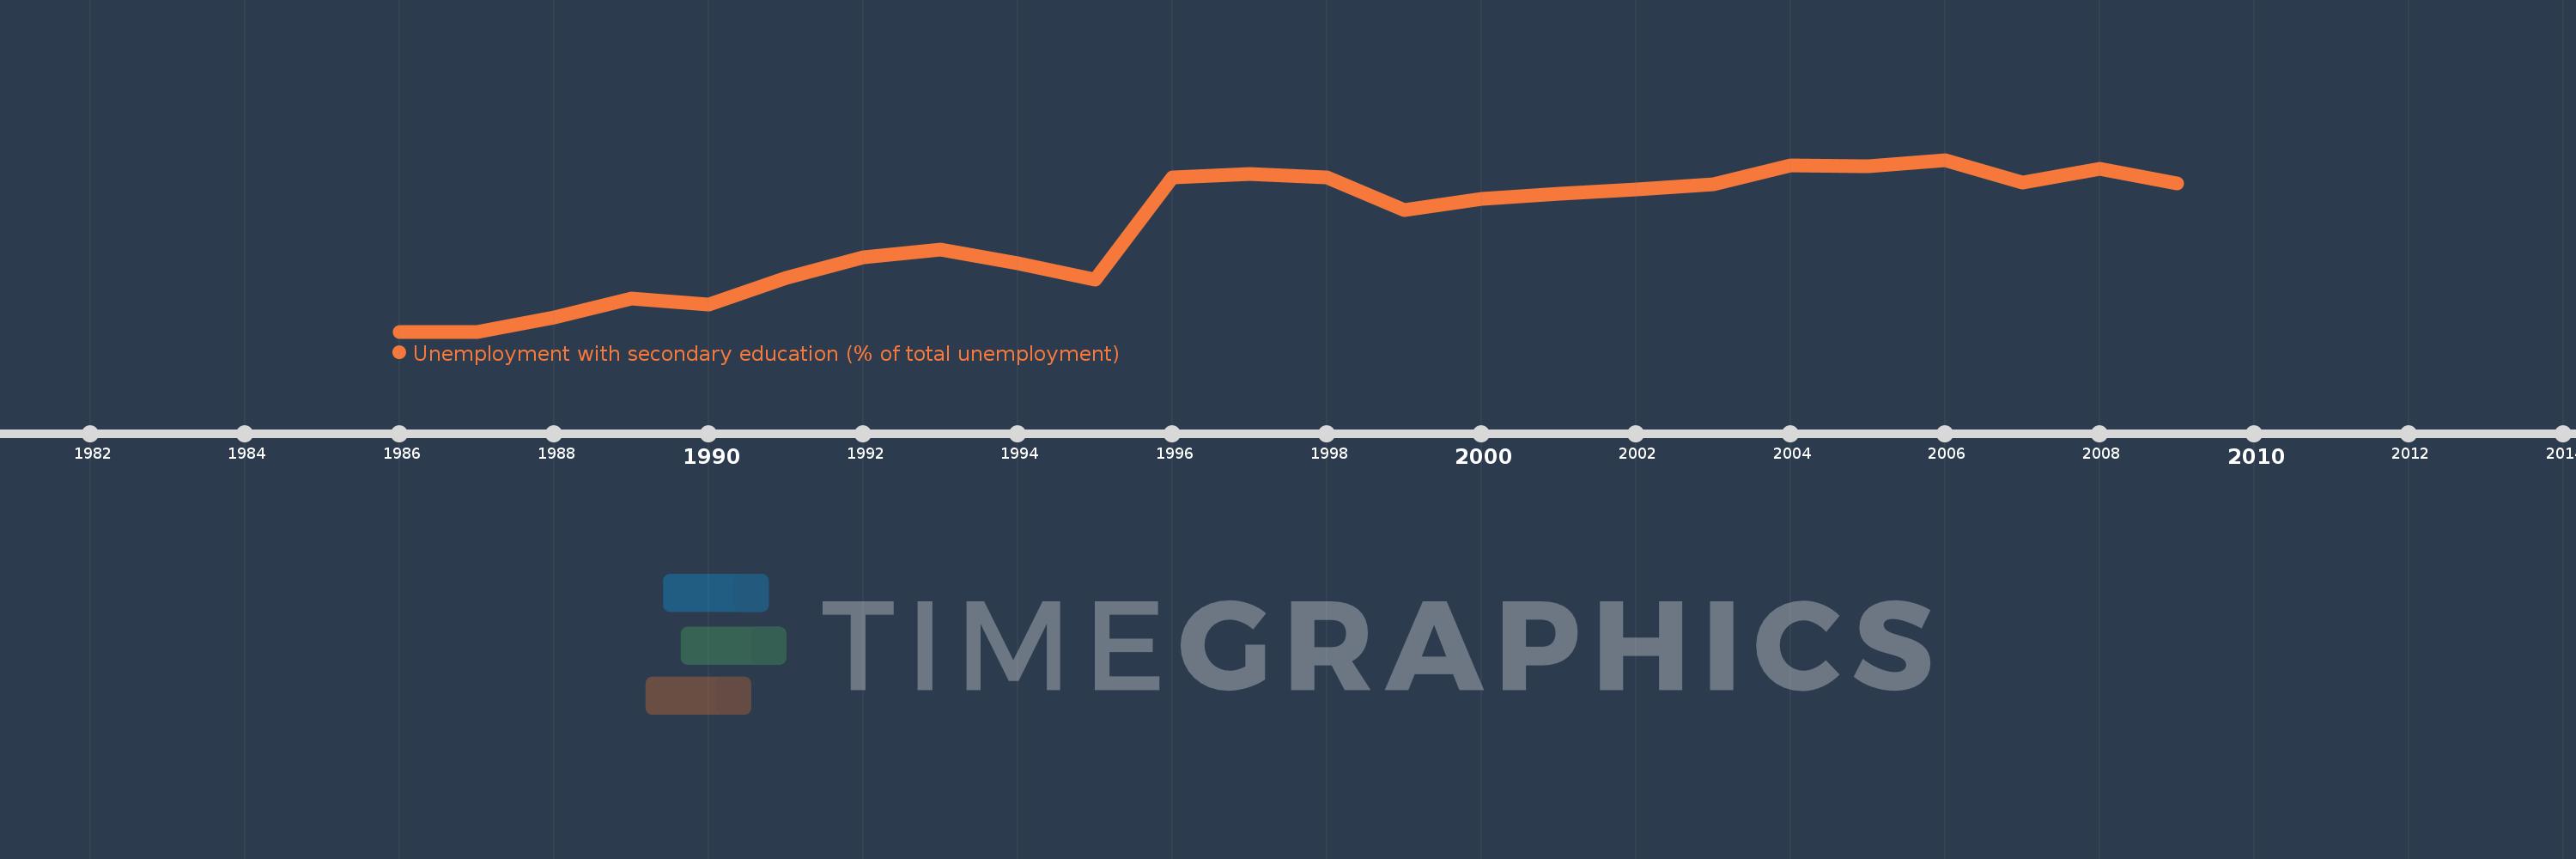
Unemployment with secondary education (% of total unemployment)
2009,2008,2007,2006,2005,2004,2003,2002,2001,2000,1999,1998,1997,1996,1995,1994,1993,1992,1991,1990,1989,1988,1987,1986
Estas estadísticas en otros países:
línea de tiempo (timeline):
En esta escala de tiempo se presenta un gráfico de 1986 y 2009 de Korea, Rep.. Los datos de 1985 están ausentes. El número de observaciones reales por fecha: 24.
Fuente (nombre):
Indicadores del desarrollo mundial
Fuente (organización):
International Labour Organization, Key Indicators of the Labour Market database.
Categorías:
Social Protection & Labor
Se ha actualizado:
23 abr 2017 año
Los indicadores de los cambios de valor en los últimos años
Mínimo:
46.8
1 ene 1986 año
Máximo:
66.4
1 ene 2006 año
A la fecha de observación
Valor
Cambio absoluto
El cambio con respecto al valor anterior
1 ene 1986 año
46.8
+46.8
0.0%
1 ene 1987 año
46.8
0.0
0.0%
1 ene 1988 año
48.4
+1.6
3.42%
1 ene 1989 año
50.6
+2.2
4.55%
1 ene 1990 año
49.9
-0.7
-1.38%
1 ene 1991 año
52.9
+3.0
6.01%
1 ene 1992 año
55.3
+2.4
4.54%
1 ene 1993 año
56.2
+0.9
1.63%
1 ene 1994 año
54.6
-1.6
-2.85%
1 ene 1995 año
52.7
-1.9
-3.48%
1 ene 1996 año
64.4
+11.7
22.2%
1 ene 1997 año
64.8
+0.4
0.62%
1 ene 1998 año
64.4
-0.4
-0.62%
1 ene 1999 año
60.7
-3.7
-5.75%
1 ene 2000 año
61.9
+1.2
1.98%
1 ene 2001 año
62.5
+0.6
0.97%
1 ene 2002 año
63.0
+0.5
0.8%
1 ene 2003 año
63.6
+0.6
0.95%
1 ene 2004 año
65.8
+2.2
3.46%
1 ene 2005 año
65.7
-0.1
-0.15%
1 ene 2006 año
66.4
+0.7
1.07%
1 ene 2007 año
63.8
-2.6
-3.92%
1 ene 2008 año
65.4
+1.6
2.51%
1 ene 2009 año
63.7
-1.7
-2.6%
Ranking de los países por los datos estadísticos actuales


Comentarios: