29
/
en
AIzaSyAYiBZKx7MnpbEhh9jyipgxe19OcubqV5w
April 1, 2024
132869
Finland
FIN
true
2
1
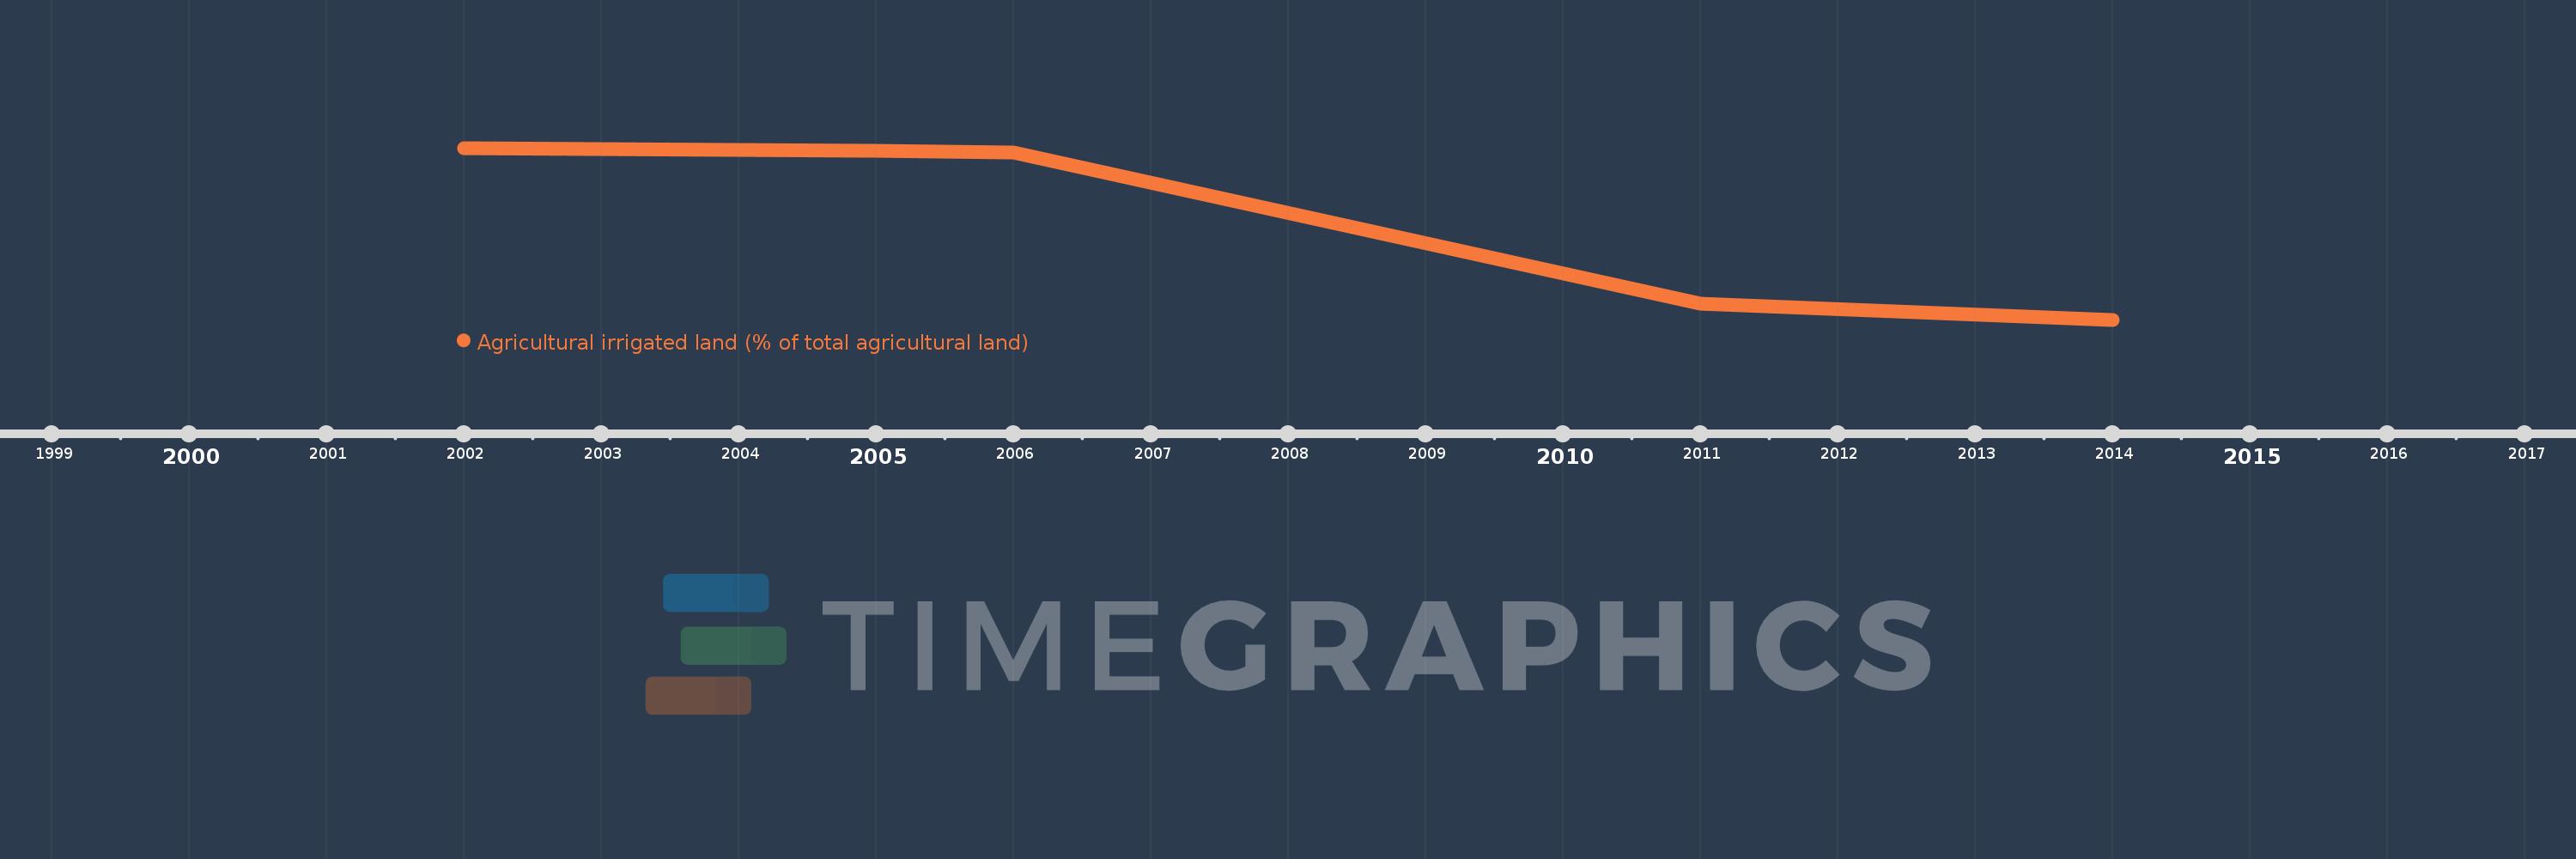
Agricultural irrigated land (% of total agricultural land)
2014,2011,2006,2005,2004,2003,2002
This statistics in other country:
Timeline:
This timeline shows a graph from 2002 to 2014 of Finland. No data until 2001. Number of actual observations by date: 7.
Source name:
World Development Indicators
Source organization:
Food and Agriculture Organization, electronic files and web site.
Categories, topics:
Agriculture & Rural Development, Climate Change
Last updated:
apr 23, 2017
Indicators value changes by year
At the date of observation
Value
Absolute change
Change from previous value
jan 1, 2002
2.88
+2.88
0.0%
jan 1, 2003
2.862
-0.018
-0.63%
jan 1, 2004
2.85
-0.013
-0.45%
jan 1, 2005
2.841
-0.009
-0.31%
jan 1, 2006
2.815
-0.026
-0.91%
jan 1, 2011
0.655
-2.159
-76.72%
jan 1, 2014
0.421
-0.235
-35.82%
Ranking of countries by current statistics by years


Comments: