29
/
en
AIzaSyAYiBZKx7MnpbEhh9jyipgxe19OcubqV5w
April 1, 2024
268927
Turkey
TUR
true
2
1
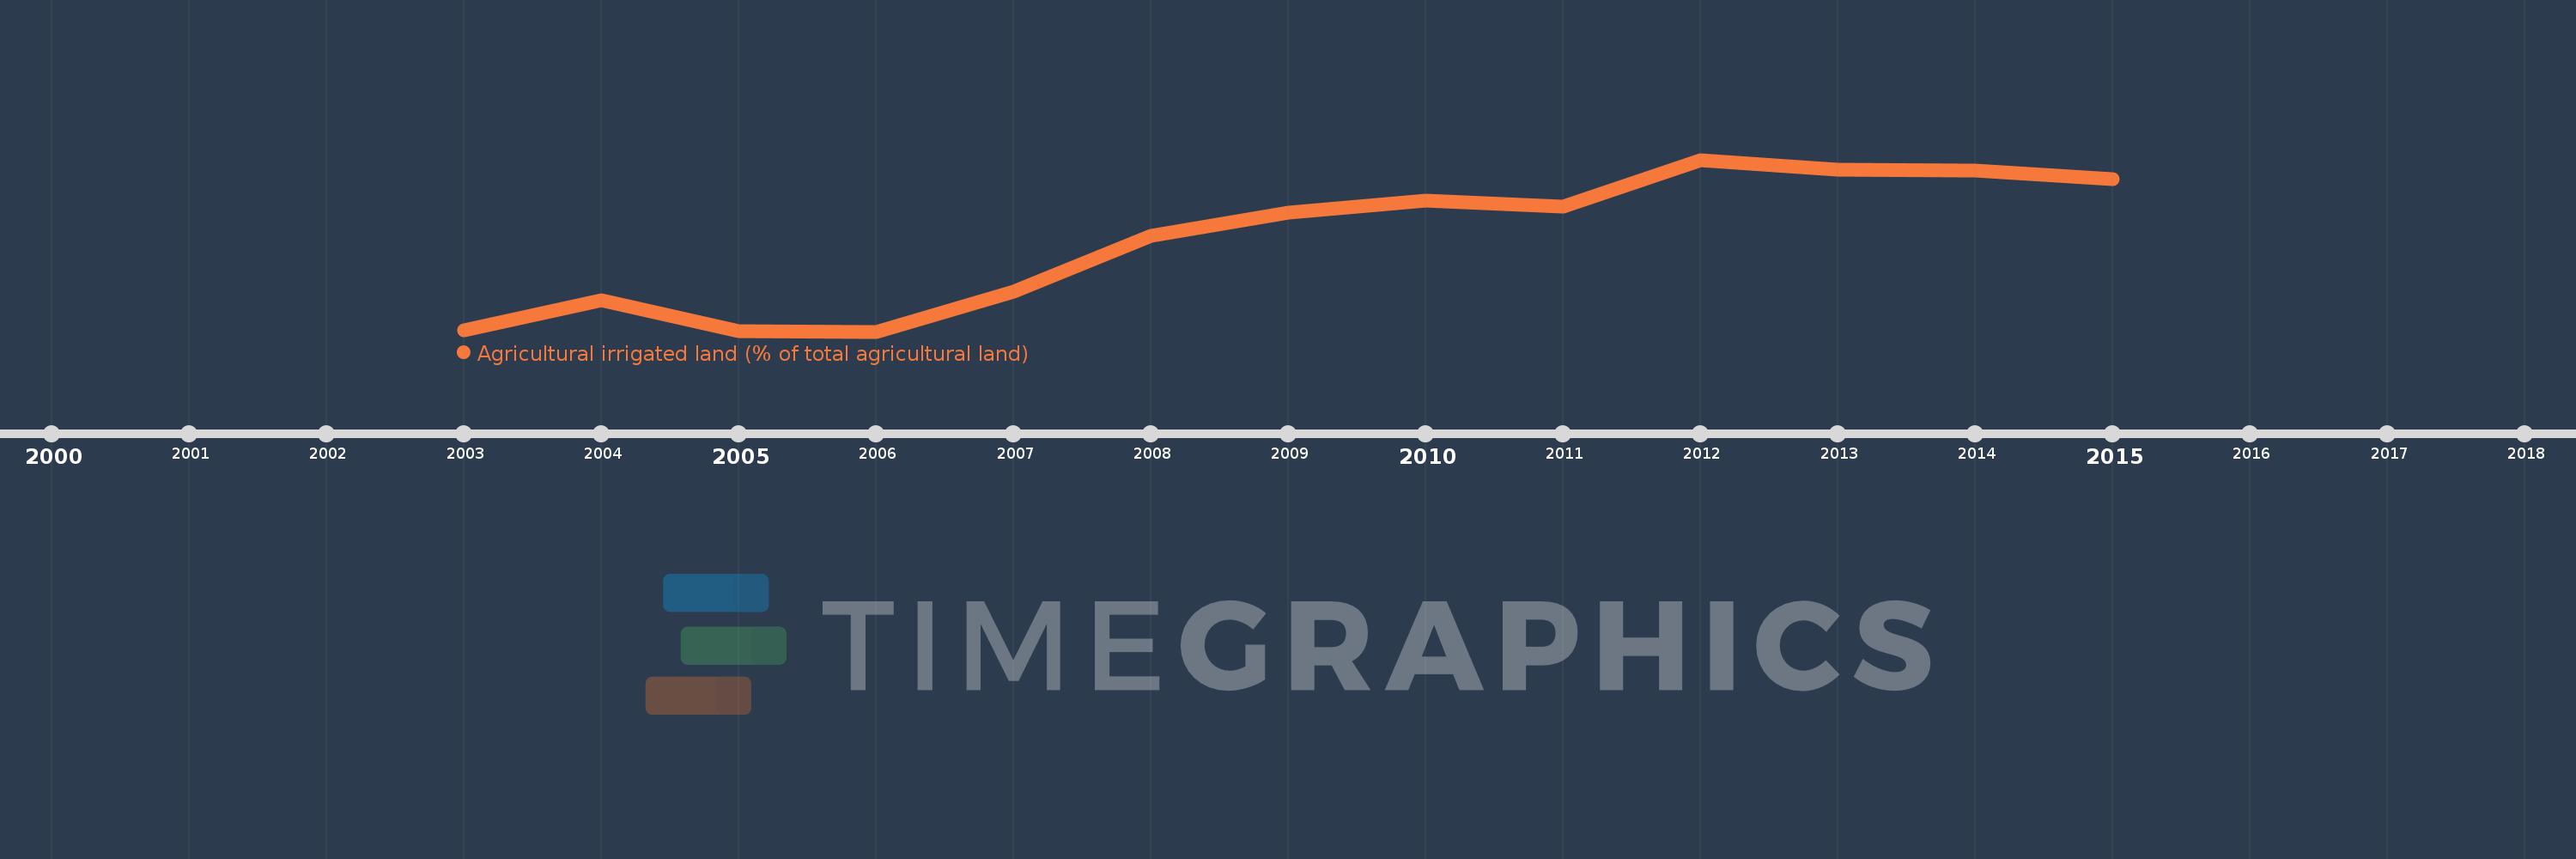
Agricultural irrigated land (% of total agricultural land)
2015,2014,2013,2012,2011,2010,2009,2008,2007,2006,2005,2004,2003
This statistics in other country:
Timeline:
This timeline shows a graph from 2003 to 2015 of Turkey. No data until 2002. Number of actual observations by date: 13.
Source name:
World Development Indicators
Source organization:
Food and Agriculture Organization, electronic files and web site.
Categories, topics:
Agriculture & Rural Development, Climate Change
Last updated:
apr 23, 2017
Indicators value changes by year
Minimum:
12.651
jan 1, 2006
Maximum:
13.635
jan 1, 2012
At the date of observation
Value
Absolute change
Change from previous value
jan 1, 2003
12.659
+12.659
0.0%
jan 1, 2004
12.831
+0.172
1.36%
jan 1, 2005
12.655
-0.176
-1.37%
jan 1, 2006
12.651
-0.004
-0.03%
jan 1, 2007
12.879
+0.228
1.8%
jan 1, 2008
13.201
+0.322
2.5%
jan 1, 2009
13.33
+0.129
0.98%
jan 1, 2010
13.402
+0.072
0.54%
jan 1, 2011
13.368
-0.035
-0.26%
jan 1, 2012
13.635
+0.267
2.0%
jan 1, 2013
13.578
-0.057
-0.42%
jan 1, 2014
13.573
-0.006
-0.04%
jan 1, 2015
13.524
-0.049
-0.36%
Ranking of countries by current statistics by years


Comments: