29
/
en
AIzaSyAYiBZKx7MnpbEhh9jyipgxe19OcubqV5w
April 1, 2024
125770
El Salvador
SLV
true
2
1
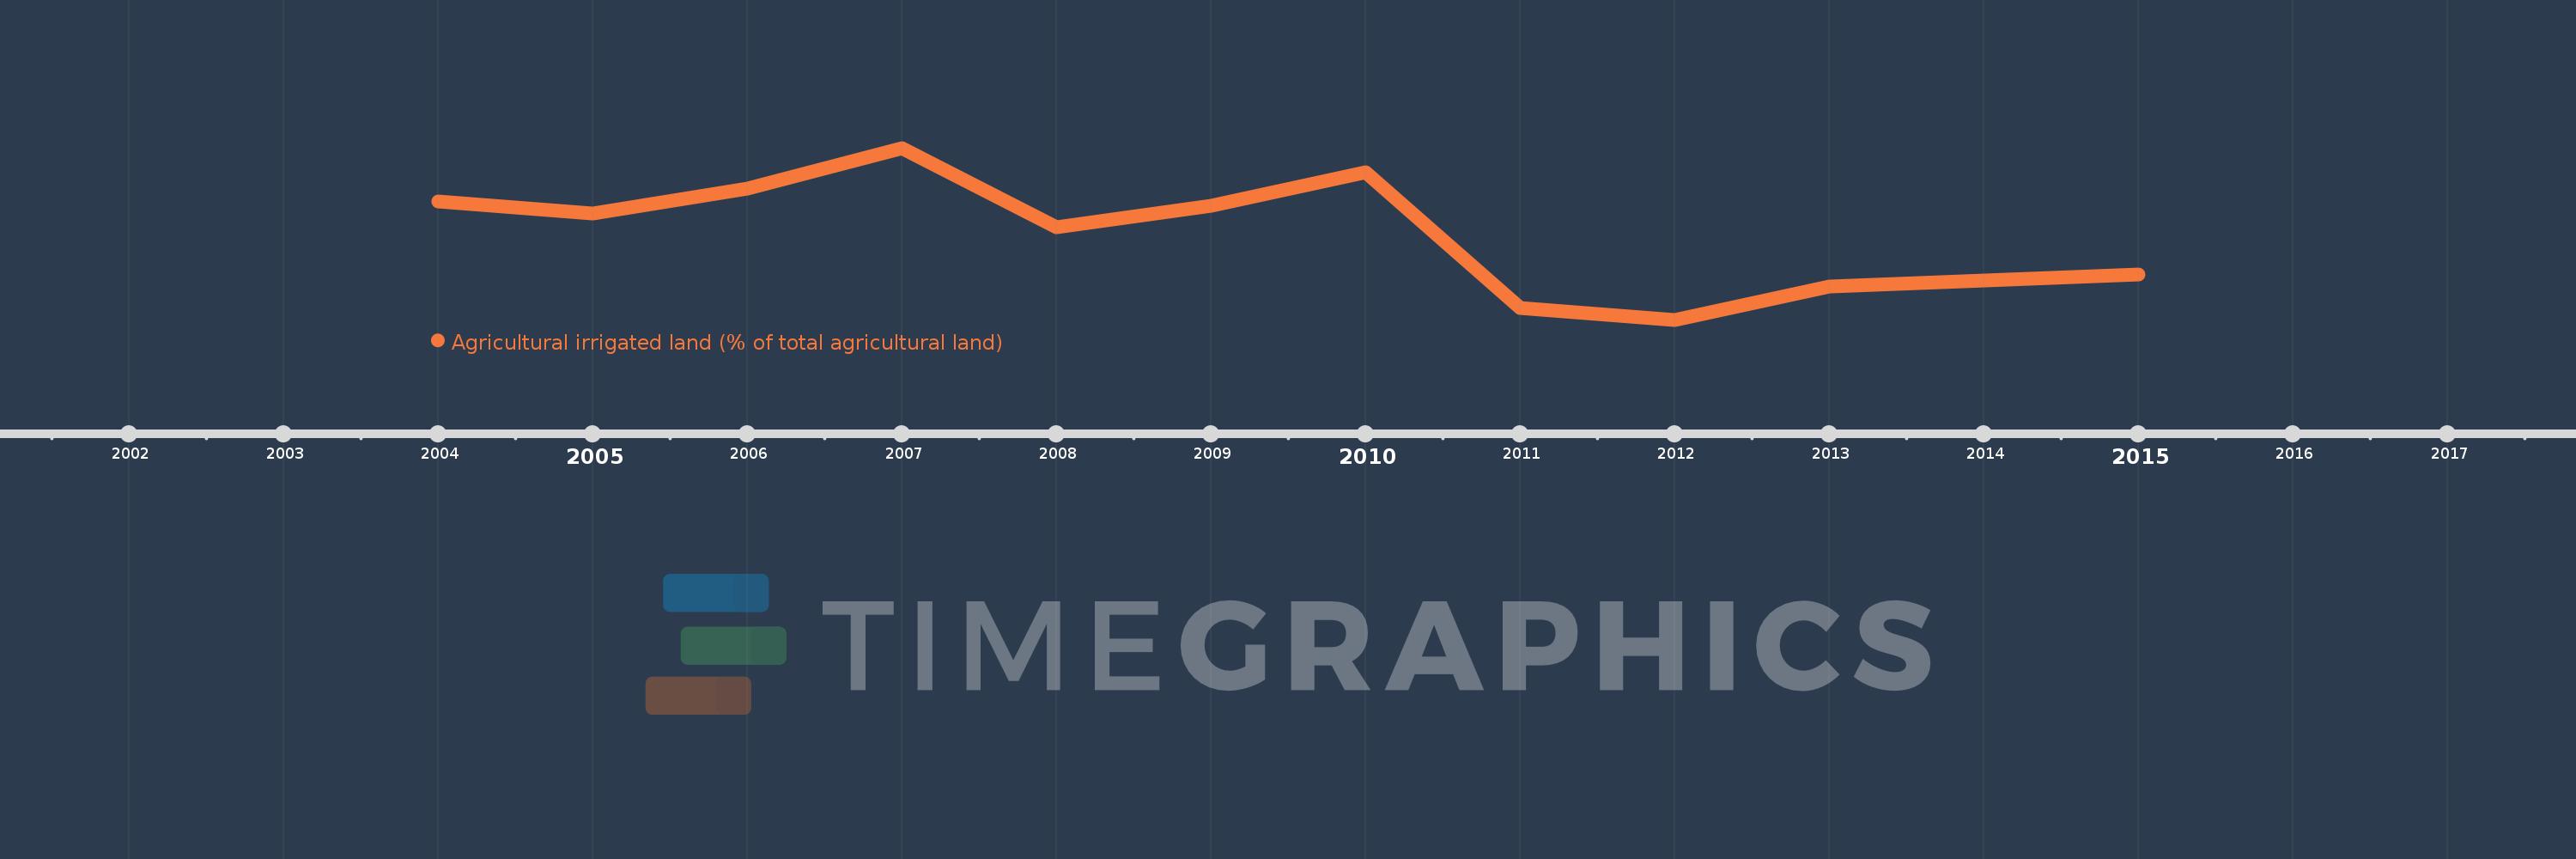
Agricultural irrigated land (% of total agricultural land)
2015,2014,2013,2012,2011,2010,2009,2008,2007,2006,2005,2004
This statistics in other country:
Timeline:
This timeline shows a graph from 2004 to 2015 of El Salvador. No data until 2003. Number of actual observations by date: 12.
Source name:
World Development Indicators
Source organization:
Food and Agriculture Organization, electronic files and web site.
Categories, topics:
Agriculture & Rural Development, Climate Change
Last updated:
apr 23, 2017
Indicators value changes by year
At the date of observation
Value
Absolute change
Change from previous value
jan 1, 2004
1.838
+1.838
0.0%
jan 1, 2005
1.752
-0.086
-4.68%
jan 1, 2006
1.923
+0.172
9.81%
jan 1, 2007
2.205
+0.282
14.64%
jan 1, 2008
1.662
-0.543
-24.61%
jan 1, 2009
1.806
+0.144
8.68%
jan 1, 2010
2.039
+0.232
12.86%
jan 1, 2011
1.107
-0.931
-45.68%
jan 1, 2012
1.024
-0.084
-7.54%
jan 1, 2013
1.253
+0.229
22.38%
jan 1, 2014
1.296
+0.043
3.4%
jan 1, 2015
1.336
+0.04
3.09%
Ranking of countries by current statistics by years


Comments: