29
/
en
AIzaSyAYiBZKx7MnpbEhh9jyipgxe19OcubqV5w
April 1, 2024
249657
St. Kitts and Nevis
KNA
true
2
1
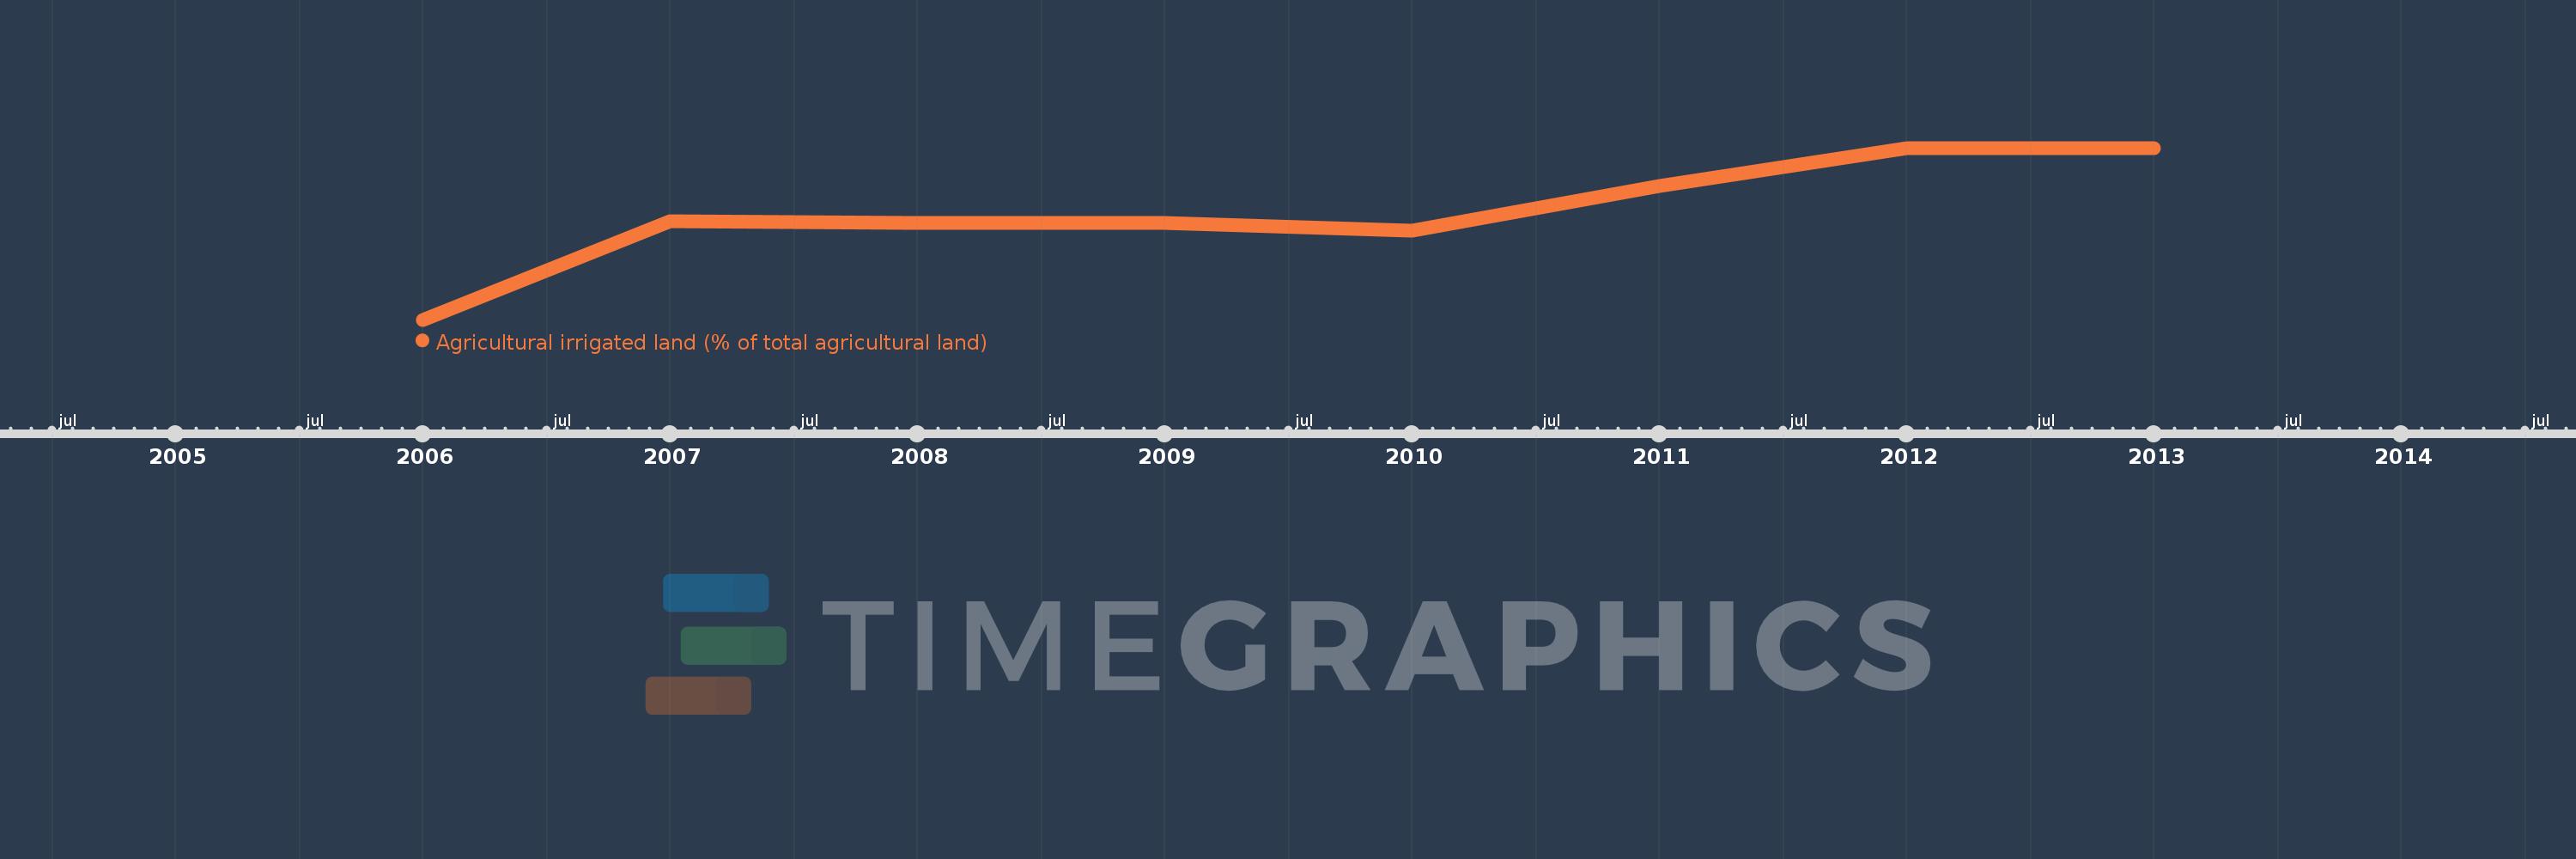
Agricultural irrigated land (% of total agricultural land)
2013,2012,2011,2010,2009,2008,2007,2006
This statistics in other country:
Timeline:
This timeline shows a graph from 2006 to 2013 of St. Kitts and Nevis. No data until 2005. Number of actual observations by date: 8.
Source name:
World Development Indicators
Source organization:
Food and Agriculture Organization, electronic files and web site.
Categories, topics:
Agriculture & Rural Development, Climate Change
Last updated:
apr 23, 2017
Indicators value changes by year
Maximum:
13.333
jan 1, 2012
At the date of observation
Value
Absolute change
Change from previous value
jan 1, 2007
7.984
+7.184
898.0%
jan 1, 2008
7.859
-0.125
-1.57%
jan 1, 2009
7.843
-0.015
-0.2%
jan 1, 2010
7.273
-0.57
-7.27%
jan 1, 2011
10.526
+3.254
44.74%
jan 1, 2012
13.333
+2.807
26.67%
jan 1, 2013
13.333
0.0
0.0%
Ranking of countries by current statistics by years


Comments: