29
/
en
AIzaSyAYiBZKx7MnpbEhh9jyipgxe19OcubqV5w
April 1, 2024
180791
Lithuania
LTU
true
2
1
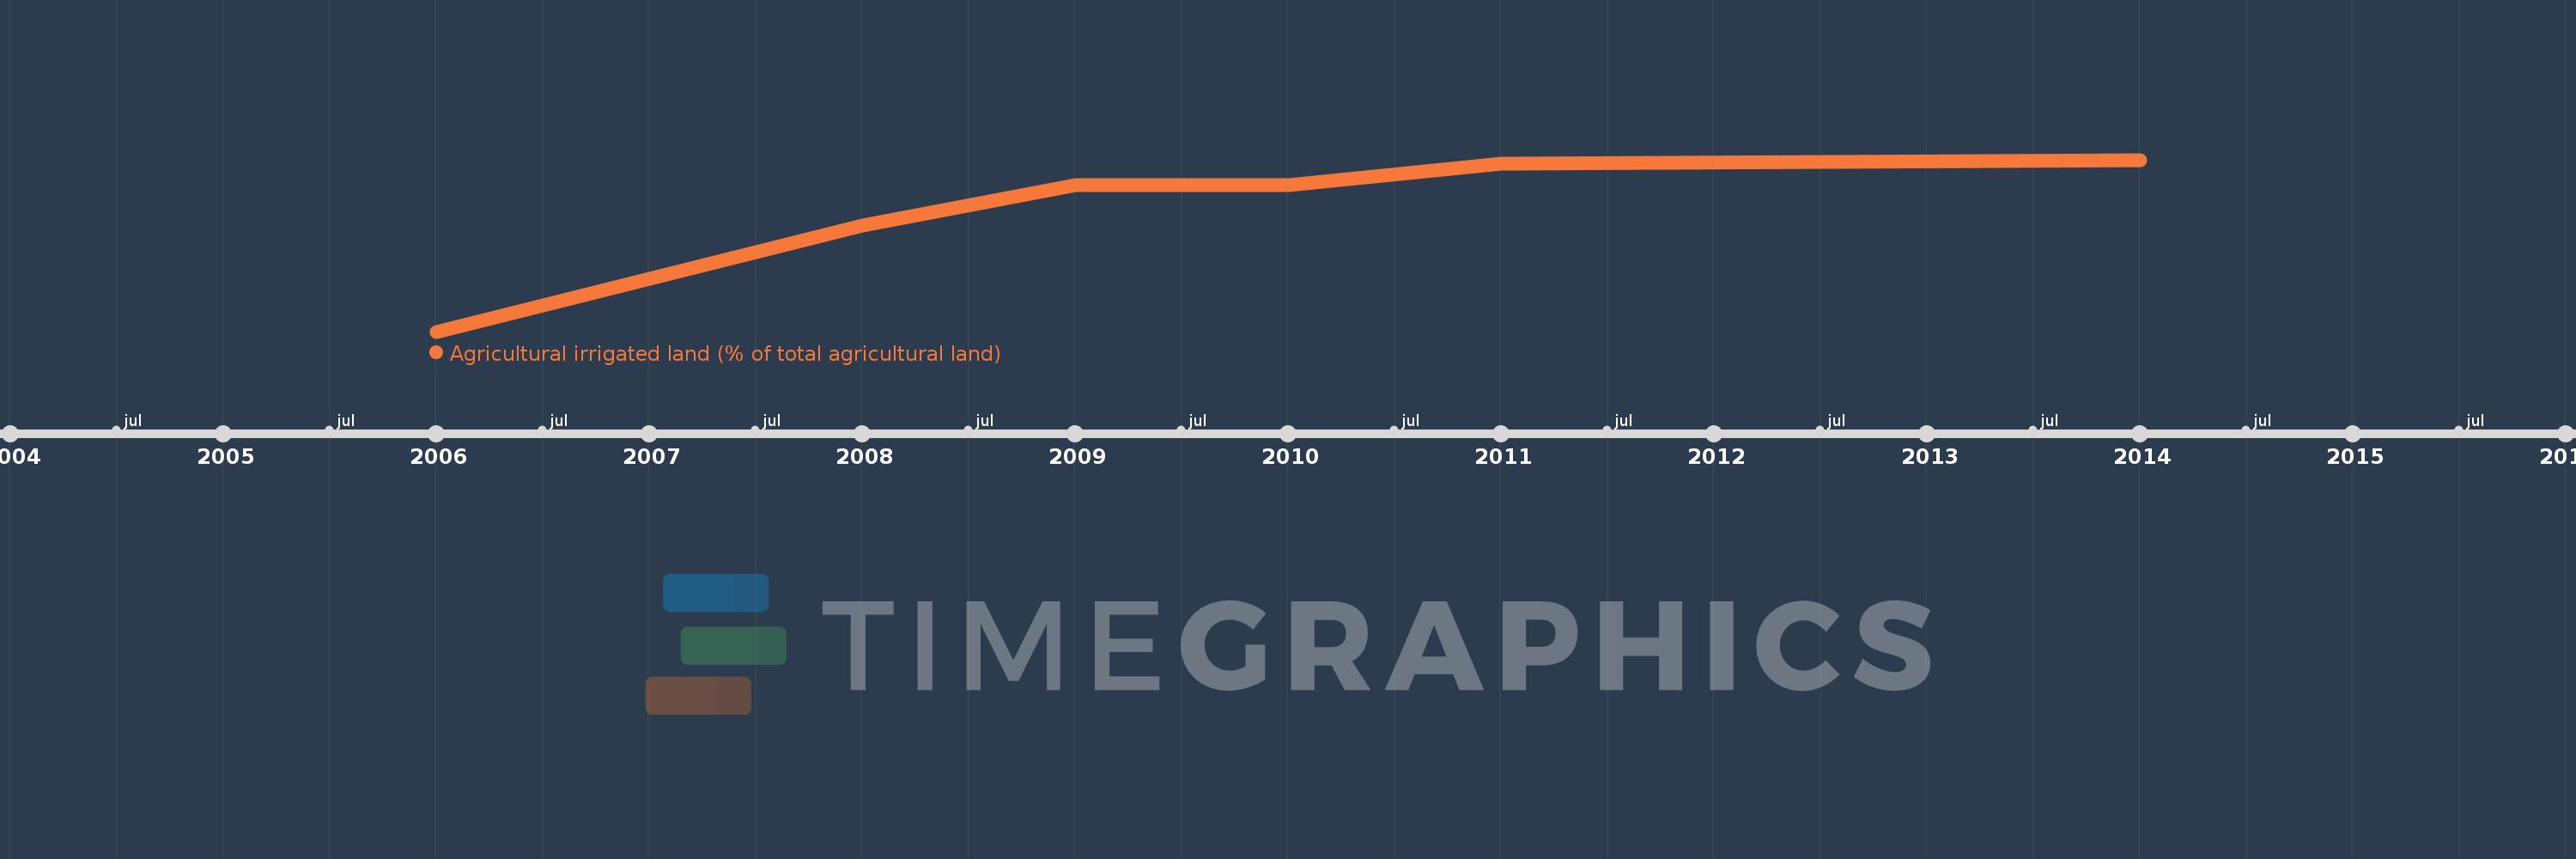
Agricultural irrigated land (% of total agricultural land)
2014,2011,2010,2009,2008,2006
This statistics in other country:
Timeline:
This timeline shows a graph from 2006 to 2014 of Lithuania. No data until 2005. Number of actual observations by date: 6.
Source name:
World Development Indicators
Source organization:
Food and Agriculture Organization, electronic files and web site.
Categories, topics:
Agriculture & Rural Development, Climate Change
Last updated:
apr 23, 2017
Indicators value changes by year
At the date of observation
Value
Absolute change
Change from previous value
jan 1, 2006
0.008
+0.008
0.0%
jan 1, 2008
0.037
+0.029
357.54%
jan 1, 2009
0.048
+0.011
29.14%
jan 1, 2010
0.048
+0.0
0.92%
jan 1, 2011
0.054
+0.006
11.92%
jan 1, 2014
0.055
+0.001
2.27%
Ranking of countries by current statistics by years


Comments: