29
/
en
AIzaSyAYiBZKx7MnpbEhh9jyipgxe19OcubqV5w
April 1, 2024
117605
Czech Republic
CZE
true
2
1
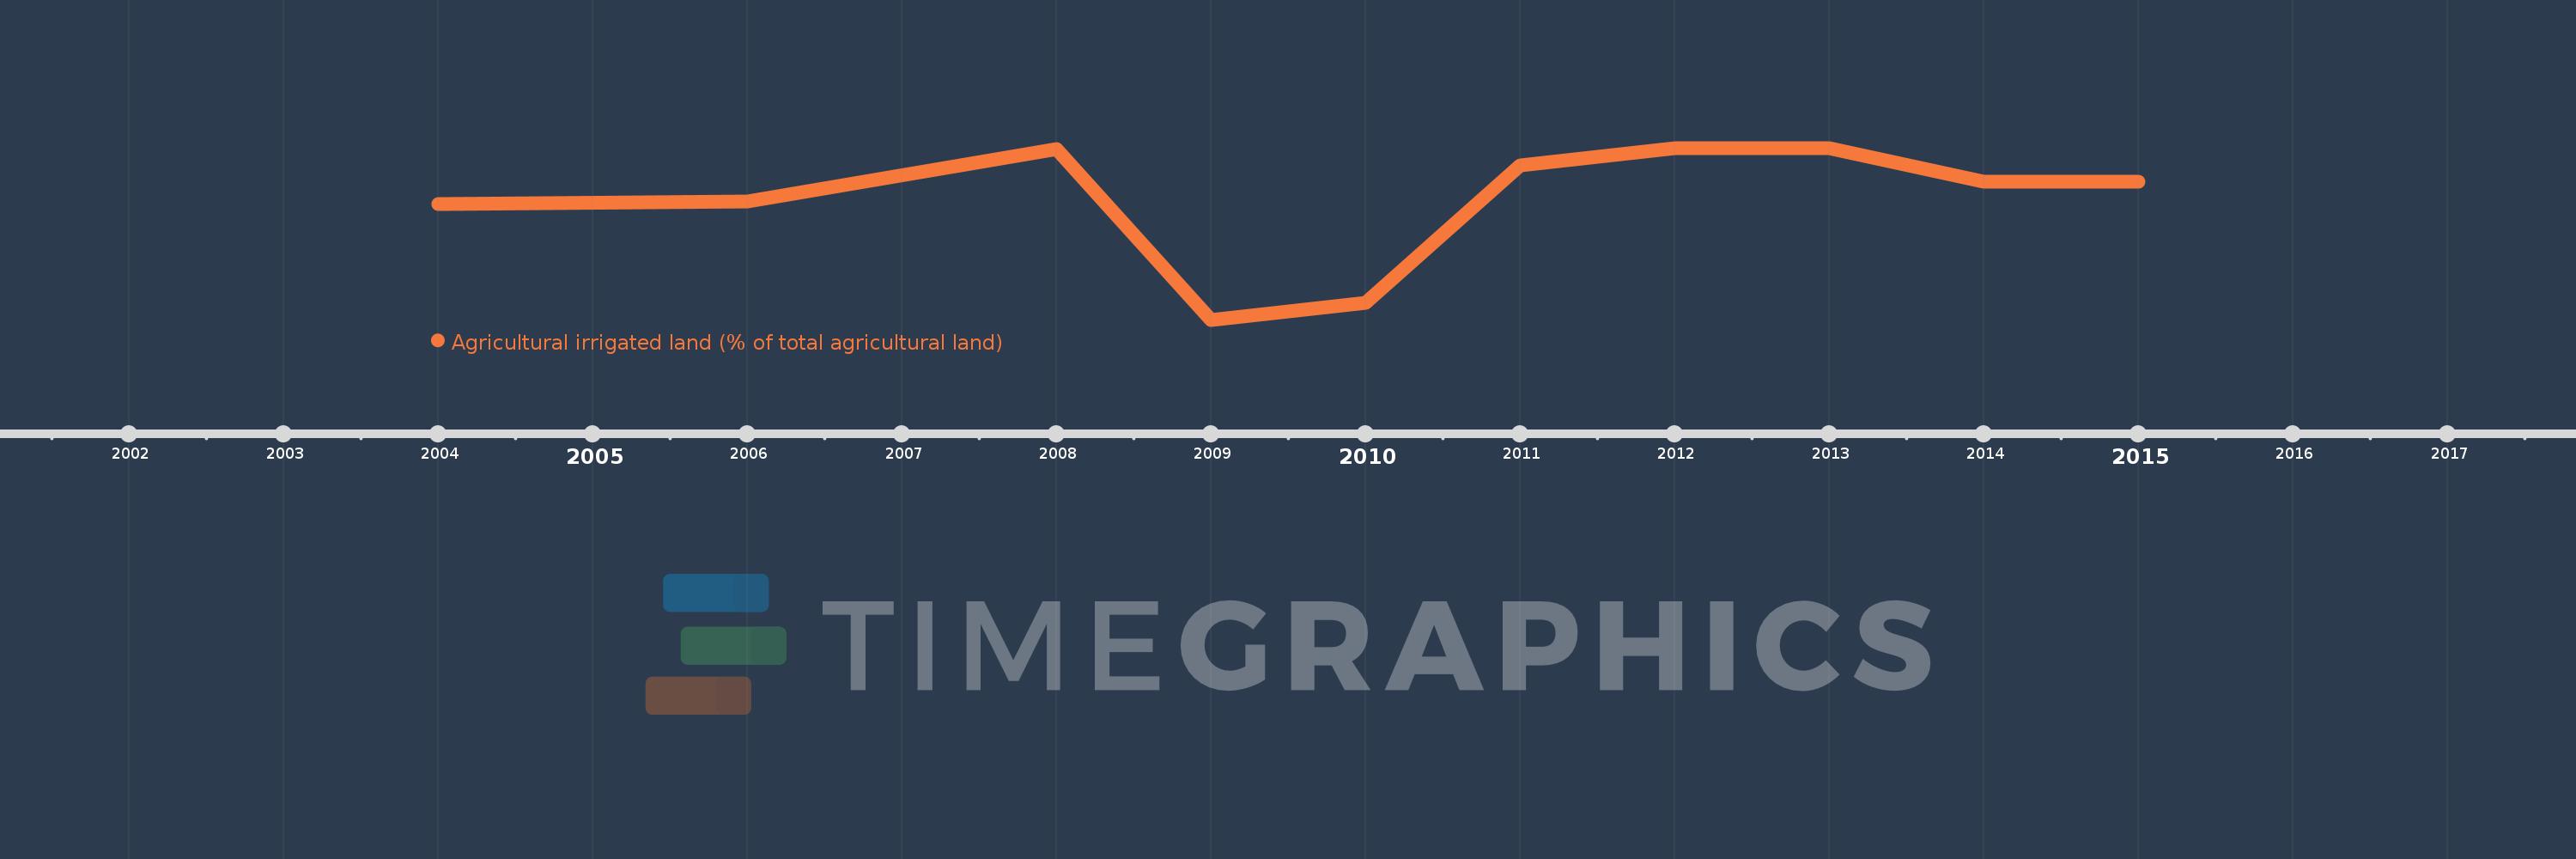
Agricultural irrigated land (% of total agricultural land)
2015,2014,2013,2012,2011,2010,2009,2008,2006,2004
This statistics in other country:
Timeline:
This timeline shows a graph from 2004 to 2015 of Czech Republic. No data until 2003. Number of actual observations by date: 10.
Source name:
World Development Indicators
Source organization:
Food and Agriculture Organization, electronic files and web site.
Categories, topics:
Agriculture & Rural Development, Climate Change
Last updated:
apr 23, 2017
Indicators value changes by year
At the date of observation
Value
Absolute change
Change from previous value
jan 1, 2004
0.396
+0.396
0.0%
jan 1, 2006
0.399
+0.003
0.8%
jan 1, 2008
0.471
+0.072
17.95%
jan 1, 2009
0.236
-0.235
-49.94%
jan 1, 2010
0.259
+0.024
10.13%
jan 1, 2011
0.449
+0.189
72.93%
jan 1, 2012
0.473
+0.024
5.39%
jan 1, 2013
0.473
+0.0
0.09%
jan 1, 2014
0.427
-0.047
-9.87%
jan 1, 2015
0.427
+0.0
0.07%
Ranking of countries by current statistics by years


Comments: