29
/
en
AIzaSyAYiBZKx7MnpbEhh9jyipgxe19OcubqV5w
April 1, 2024
191131
Malta
MLT
true
2
1
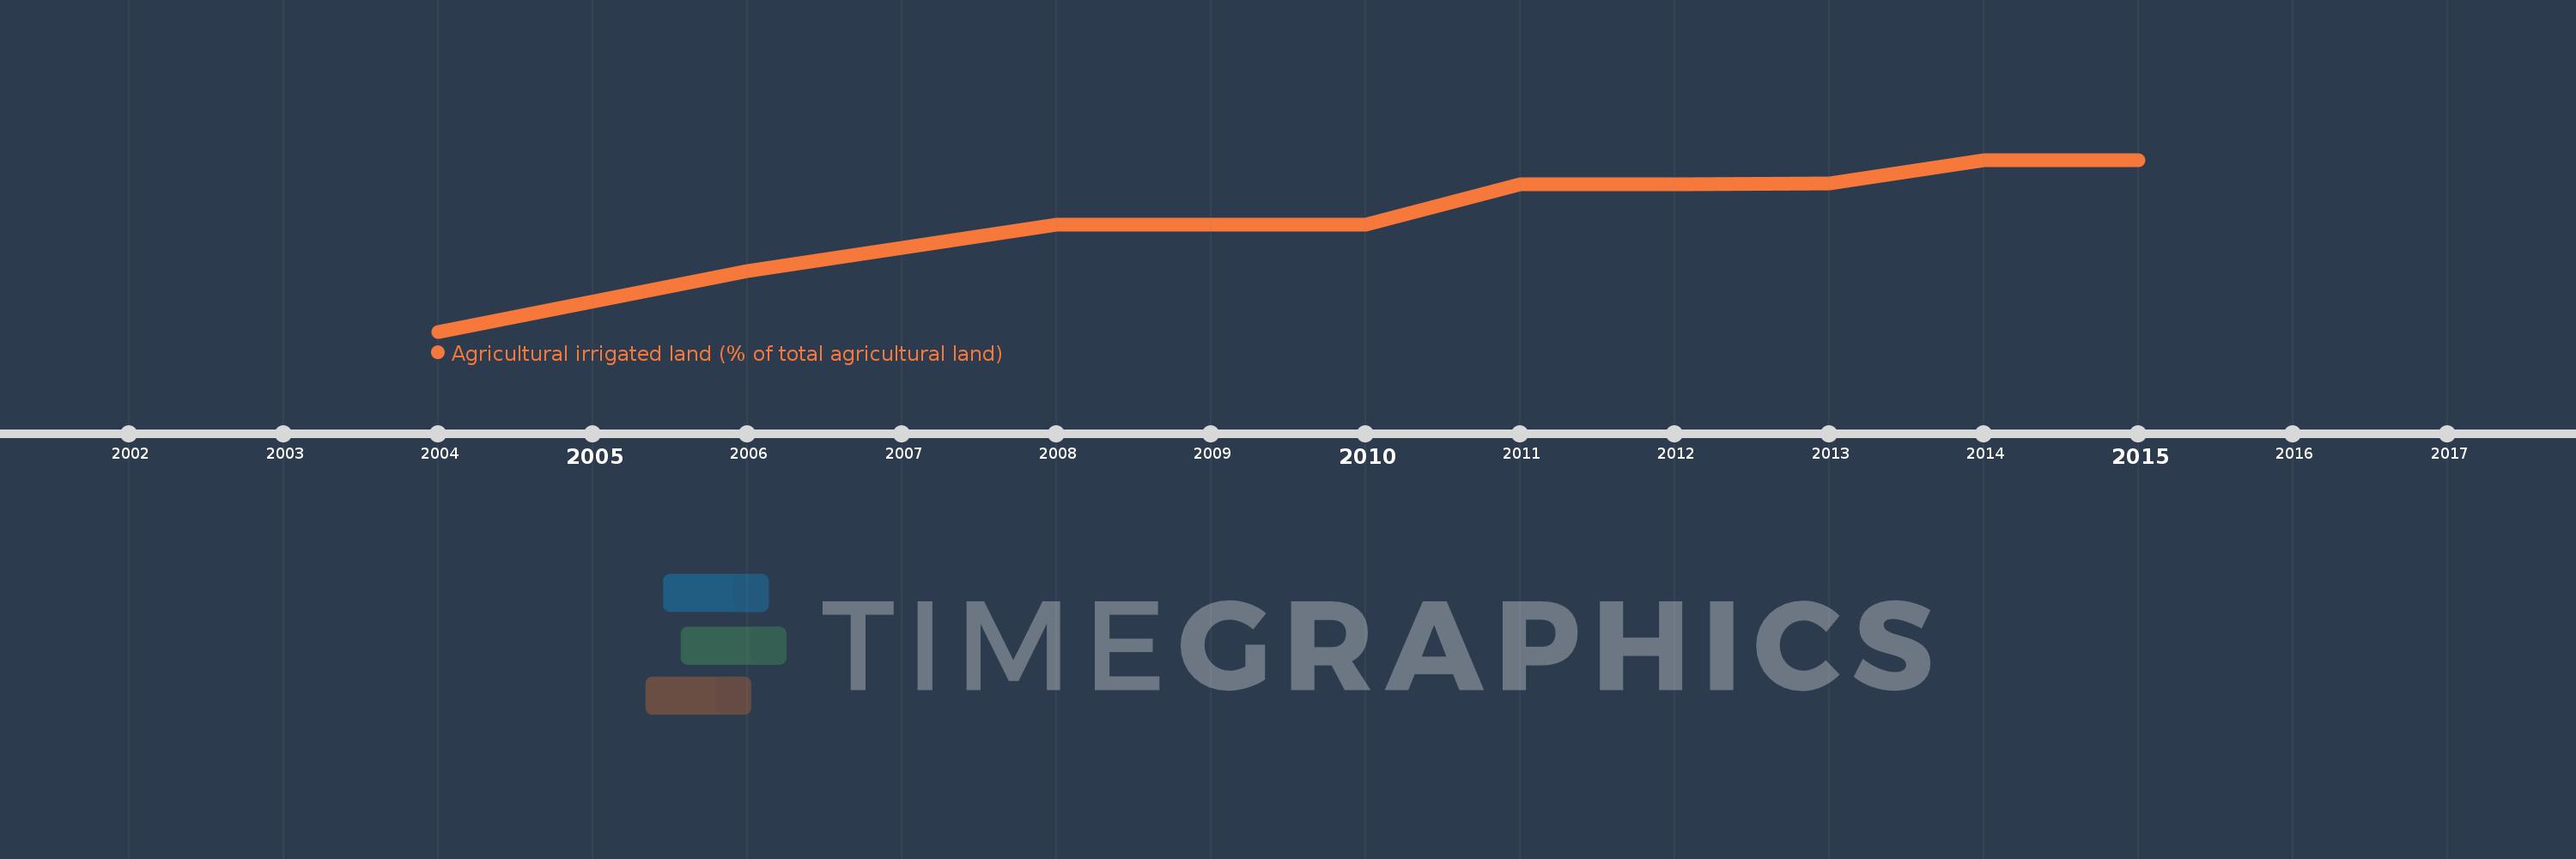
Agricultural irrigated land (% of total agricultural land)
2015,2014,2013,2012,2011,2010,2009,2008,2006,2004
This statistics in other country:
Timeline:
This timeline shows a graph from 2004 to 2015 of Malta. No data until 2003. Number of actual observations by date: 10.
Source name:
World Development Indicators
Source organization:
Food and Agriculture Organization, electronic files and web site.
Categories, topics:
Agriculture & Rural Development, Climate Change
Last updated:
apr 23, 2017
Indicators value changes by year
Minimum:
20.192
jan 1, 2004
Maximum:
36.168
jan 1, 2014
At the date of observation
Value
Absolute change
Change from previous value
jan 1, 2004
20.192
+20.192
0.0%
jan 1, 2006
25.806
+5.614
27.8%
jan 1, 2008
30.108
+4.301
16.67%
jan 1, 2009
30.108
0.0
0.0%
jan 1, 2010
30.108
0.0
0.0%
jan 1, 2011
33.882
+3.774
12.54%
jan 1, 2012
33.882
0.0
0.0%
jan 1, 2013
33.981
+0.099
0.29%
jan 1, 2014
36.168
+2.188
6.44%
jan 1, 2015
36.168
0.0
0.0%
Ranking of countries by current statistics by years


Comments: