29
/pt/
pt
AIzaSyAYiBZKx7MnpbEhh9jyipgxe19OcubqV5w
April 1, 2024
97602
Cabo Verde
CPV
true
2
1
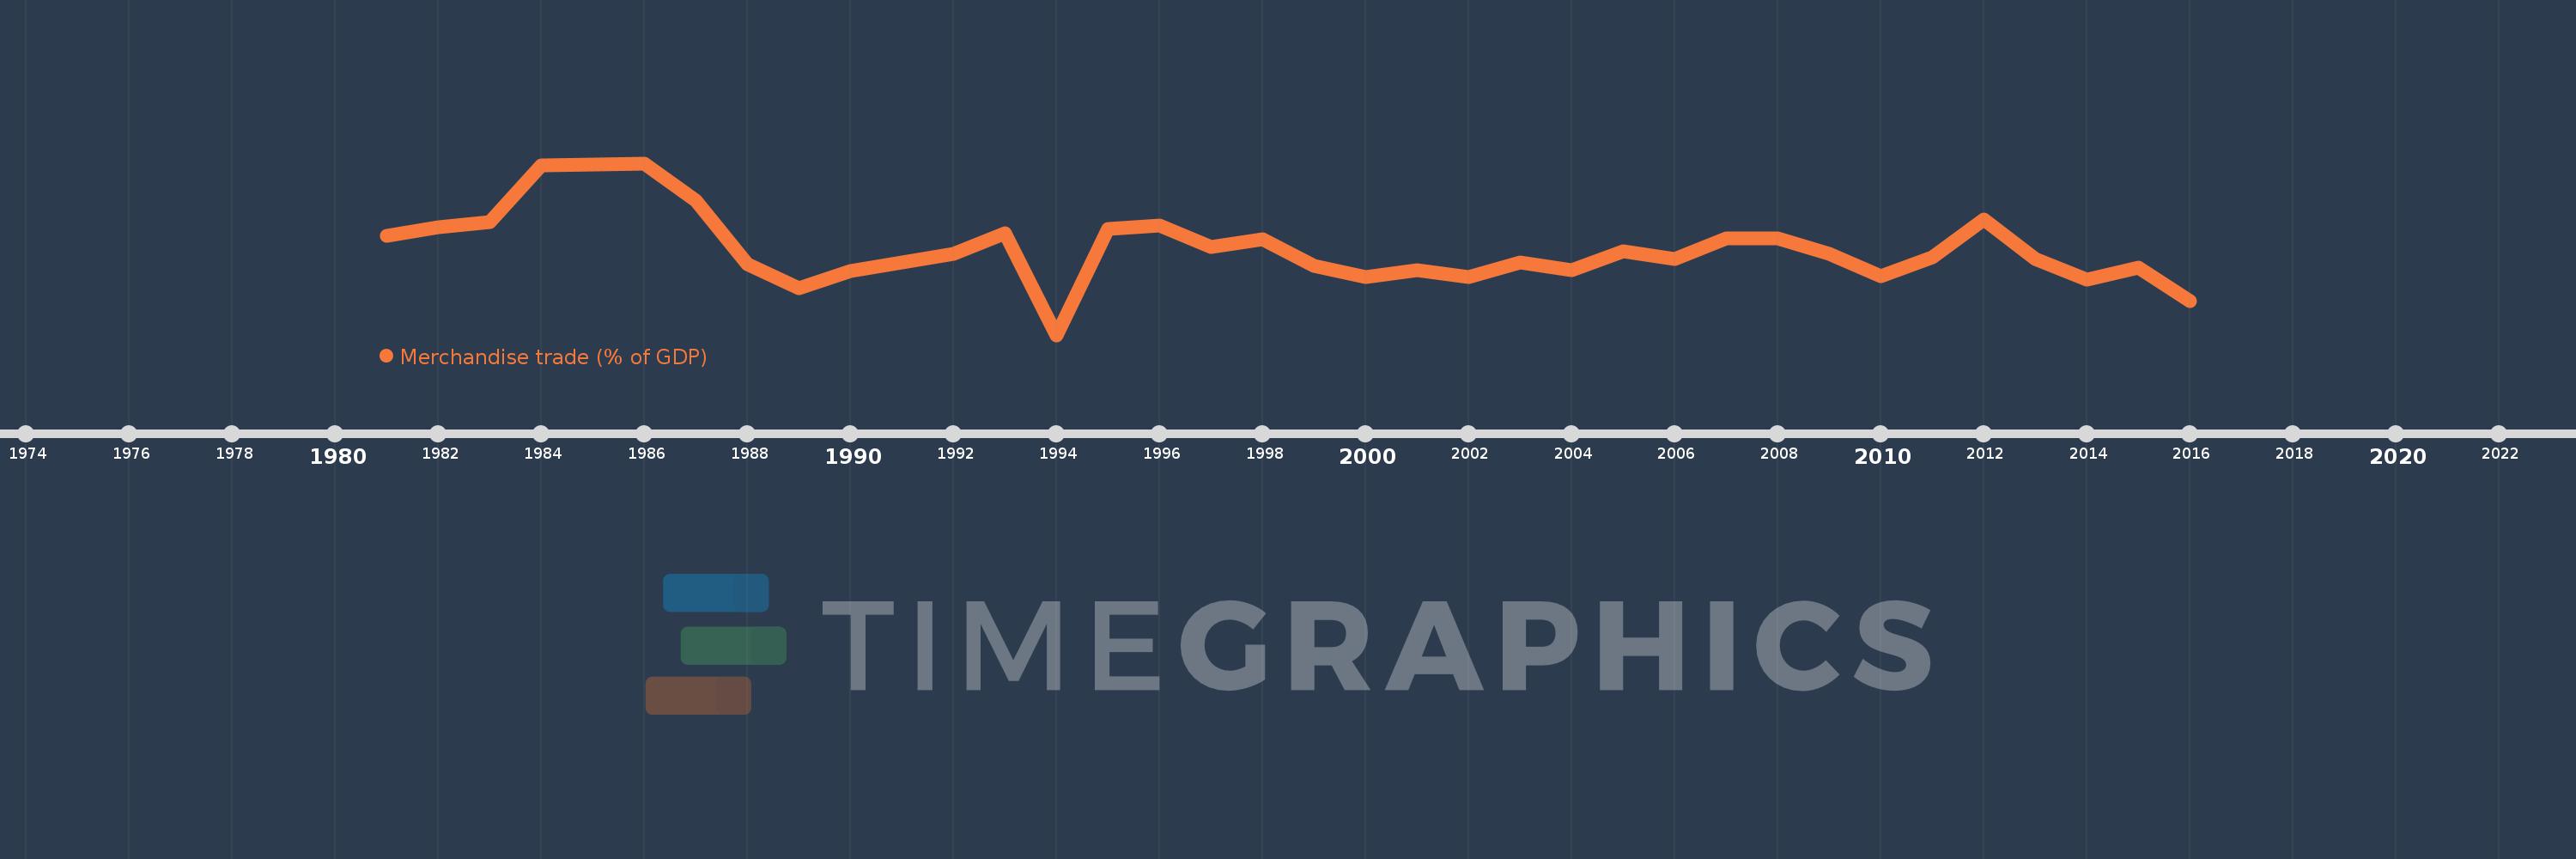
Merchandise trade (% of GDP)
2016,2015,2014,2013,2012,2011,2010,2009,2008,2007,2006,2005,2004,2003,2002,2001,2000,1999,1998,1997,1996,1995,1994,1993,1992,1991,1990,1989,1988,1987,1986,1985,1984,1983,1982,1981
Estas estatísticas em outros países:
AfghanistanAlbaniaAlgeriaAngolaAntigua and BarbudaArab WorldArgentinaArmeniaArubaAustraliaAustriaAzerbaijanBahamas, TheBahrainBangladeshBarbadosBelarusBelgiumBelizeBeninBermudaBhutanBoliviaBosnia and HerzegovinaBotswanaBrazilBrunei DarussalamBulgariaBurkina FasoBurundiCabo VerdeCambodiaCameroonCanadaCaribbean small statesCentral African RepublicCentral Europe and the BalticsChadChileChinaColombiaComorosCongo, Dem. Rep.Congo, Rep.Costa RicaCote d'IvoireCroatiaCubaCyprusCzech RepublicDenmarkDjiboutiDominicaDominican RepublicEarly-demographic dividendEast Asia & PacificEast Asia & Pacific (excluding high income)East Asia & Pacific (IDA & IBRD countries)EcuadorEgypt, Arab Rep.El SalvadorEquatorial GuineaEritreaEstoniaEthiopiaEuro areaEurope & Central AsiaEurope & Central Asia (excluding high income)Europe & Central Asia (IDA & IBRD countries)European UnionFaroe IslandsFijiFinlandFragile and conflict affected situationsFranceFrench PolynesiaGabonGambia, TheGeorgiaGermanyGhanaGreeceGreenlandGrenadaGuatemalaGuineaGuinea-BissauGuyanaHaitiHeavily indebted poor countries (HIPC)High incomeHondurasHong Kong SAR, ChinaHungaryIBRD onlyIcelandIDA & IBRD totalIDA blendIDA onlyIDA totalIndiaIndonesiaIran, Islamic Rep.IraqIrelandIsraelItalyJamaicaJapanJordanKazakhstanKenyaKiribatiKorea, Rep.KuwaitKyrgyz RepublicLao PDRLate-demographic dividendLatin America & Caribbean Latin America & Caribbean (excluding high income)Latin America & the Caribbean (IDA & IBRD countries)LatviaLeast developed countries: UN classificationLebanonLesothoLiberiaLibyaLithuaniaLow & middle incomeLow incomeLower middle incomeLuxembourgMacao SAR, ChinaMacedonia, FYRMadagascarMalawiMalaysiaMaldivesMaliMaltaMarshall IslandsMauritaniaMauritiusMexicoMicronesia, Fed. Sts.Middle East & North AfricaMiddle East & North Africa (excluding high income)Middle East & North Africa (IDA & IBRD countries)Middle incomeMoldovaMongoliaMontenegroMoroccoMozambiqueMyanmarNamibiaNepalNetherlandsNew CaledoniaNew ZealandNicaraguaNigerNigeriaNorth AmericaNorwayOECD membersOmanOther small statesPacific island small statesPakistanPalauPanamaPapua New GuineaParaguayPeruPhilippinesPolandPortugalPost-demographic dividendPre-demographic dividendQatarRomaniaRussian FederationRwandaSamoaSao Tome and PrincipeSaudi ArabiaSenegalSerbiaSeychellesSierra LeoneSingaporeSlovak RepublicSloveniaSmall statesSolomon IslandsSouth AfricaSouth AsiaSouth Asia (IDA & IBRD)SpainSri LankaSt. Kitts and NevisSt. LuciaSt. Vincent and the GrenadinesSub-Saharan Africa Sub-Saharan Africa (excluding high income)Sub-Saharan Africa (IDA & IBRD countries)SudanSurinameSwazilandSwedenSwitzerlandSyrian Arab RepublicTajikistanTanzaniaThailandTimor-LesteTogoTongaTrinidad and TobagoTunisiaTurkeyTurkmenistanTuvaluUgandaUkraineUnited Arab EmiratesUnited KingdomUnited StatesUpper middle incomeUruguayUzbekistanVanuatuVenezuela, RBVietnamWorldYemen, Rep.ZambiaZimbabwe Linha do tempo:
Nesta escala de tempo está apresentado um gráfico de 1981 ano até 2016 ano Cabo Verde. Dados de 1980 ano ausente. O número de observações reais por data: 36.
Fonte (nome):
Indicadores de desenvolvimento mundial
Fonte (organização):
World Trade Organization, and World Bank GDP estimates.
Categorias:
Private Sector, Trade
Foi atualizado:
23 abr 2017 ano
Indicadores de alterações dos valores ao longo dos anos
Mínimo:
32.217
1 jan 1994 ano
Máximo:
65.346
1 jan 1986 ano
Na data de observação
Valor
Mudança absoluta
A alteração em relação ao valor anterior
1 jan 1981 ano
51.319
+51.319
0.0%
1 jan 1982 ano
53.059
+1.739
3.39%
1 jan 1983 ano
54.042
+0.984
1.85%
1 jan 1984 ano
64.993
+10.951
20.26%
1 jan 1985 ano
65.142
+0.149
0.23%
1 jan 1986 ano
65.346
+0.204
0.31%
1 jan 1987 ano
58.222
-7.125
-10.9%
1 jan 1988 ano
45.908
-12.314
-21.15%
1 jan 1989 ano
41.24
-4.668
-10.17%
1 jan 1990 ano
44.495
+3.255
7.89%
1 jan 1991 ano
46.27
+1.776
3.99%
1 jan 1992 ano
47.838
+1.568
3.39%
1 jan 1993 ano
51.797
+3.959
8.28%
1 jan 1994 ano
32.217
-19.58
-37.8%
1 jan 1995 ano
52.634
+20.417
63.37%
1 jan 1996 ano
53.372
+0.738
1.4%
1 jan 1997 ano
49.205
-4.167
-7.81%
1 jan 1998 ano
50.753
+1.548
3.15%
1 jan 1999 ano
45.602
-5.152
-10.15%
1 jan 2000 ano
43.382
-2.22
-4.87%
1 jan 2001 ano
44.694
+1.312
3.02%
1 jan 2002 ano
43.337
-1.356
-3.03%
1 jan 2003 ano
46.144
+2.806
6.48%
1 jan 2004 ano
44.688
-1.456
-3.16%
1 jan 2005 ano
48.296
+3.608
8.07%
1 jan 2006 ano
46.896
-1.4
-2.9%
1 jan 2007 ano
50.798
+3.902
8.32%
1 jan 2008 ano
50.801
+0.003
0.01%
1 jan 2009 ano
47.911
-2.89
-5.69%
1 jan 2010 ano
43.482
-4.429
-9.24%
1 jan 2011 ano
47.278
+3.796
8.73%
1 jan 2012 ano
54.483
+7.205
15.24%
1 jan 2013 ano
46.922
-7.561
-13.88%
1 jan 2014 ano
42.885
-4.037
-8.6%
1 jan 2015 ano
45.294
+2.409
5.62%
1 jan 2016 ano
38.722
-6.572
-14.51%
Classificação de países por estatísticas atuais por anos


Comentários: