29
/pt/
pt
AIzaSyAYiBZKx7MnpbEhh9jyipgxe19OcubqV5w
April 1, 2024
61838
Upper middle income
UMC
false
2
1
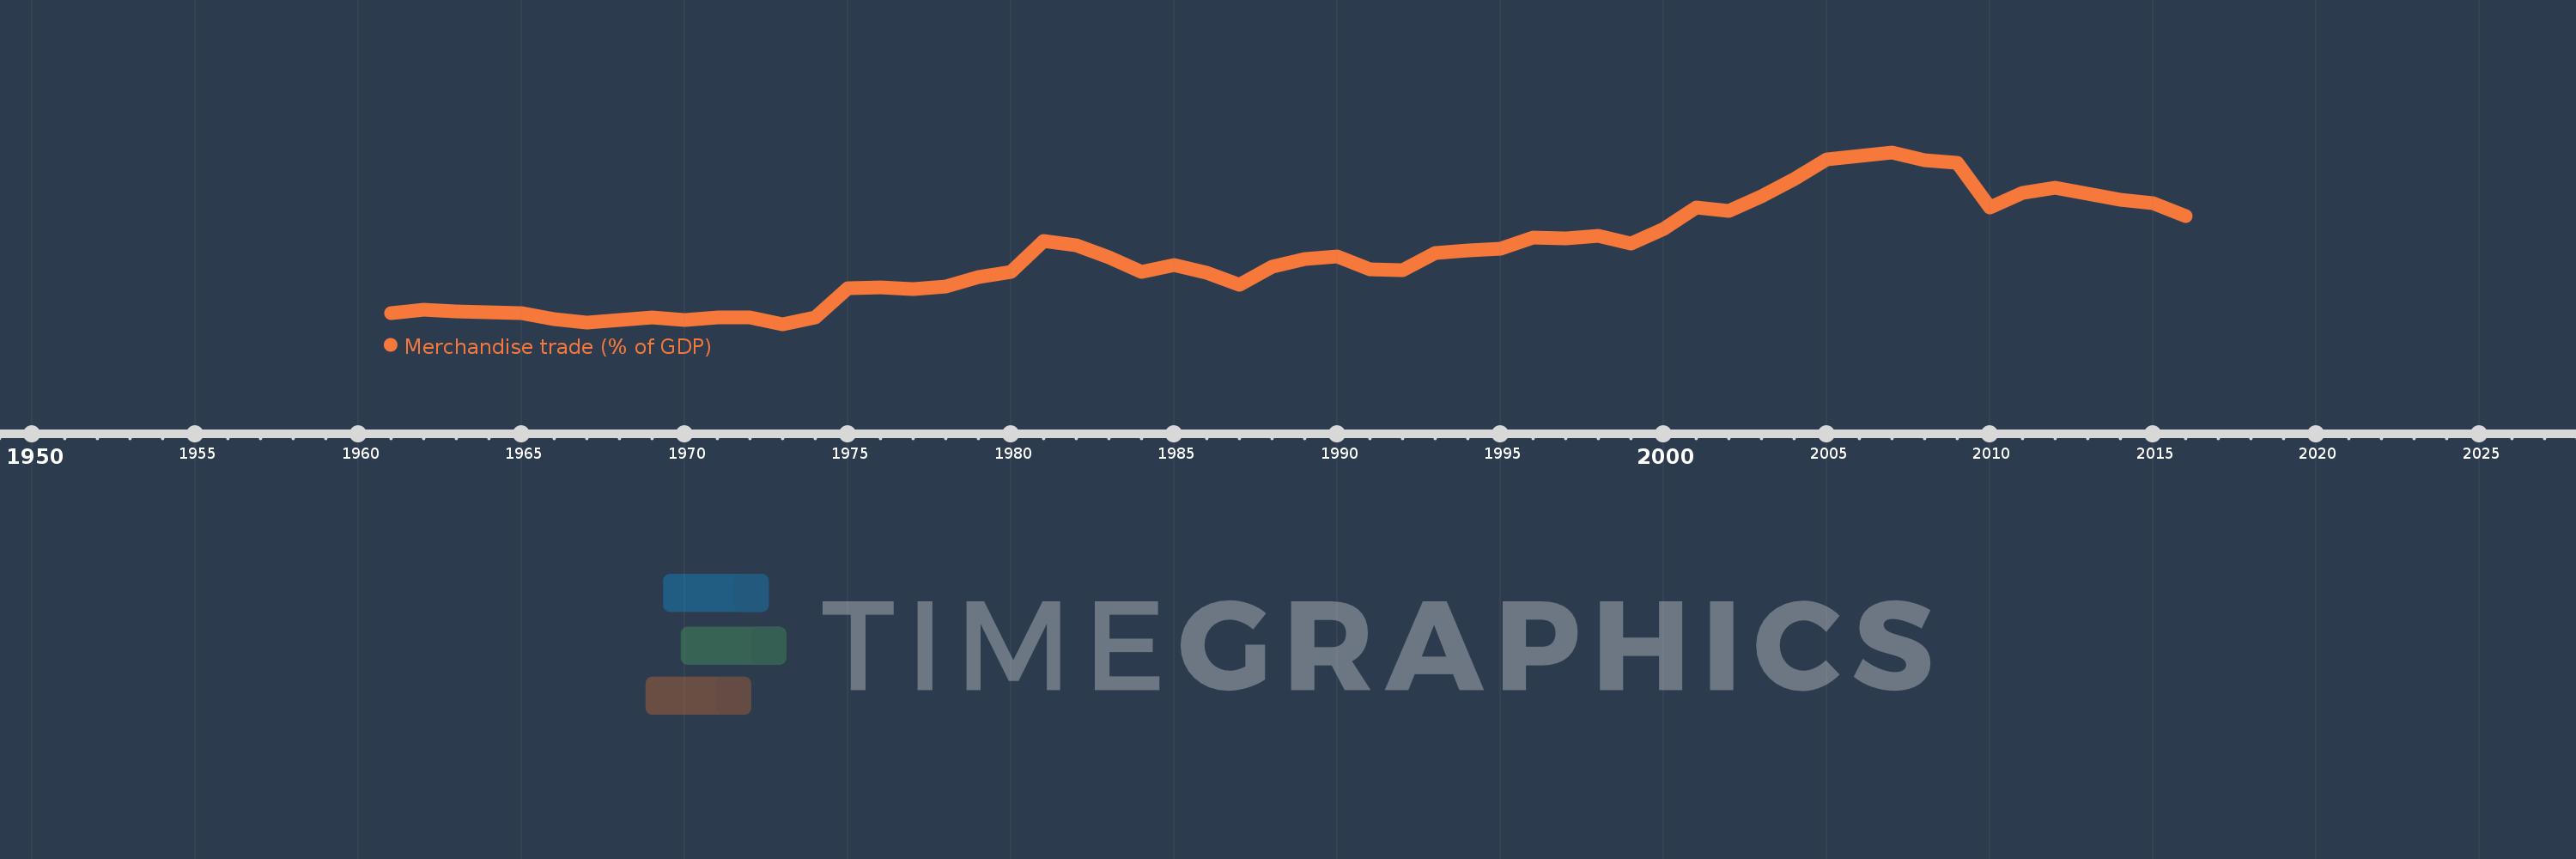
Merchandise trade (% of GDP)
2016,2015,2014,2013,2012,2011,2010,2009,2008,2007,2006,2005,2004,2003,2002,2001,2000,1999,1998,1997,1996,1995,1994,1993,1992,1991,1990,1989,1988,1987,1986,1985,1984,1983,1982,1981,1980,1979,1978,1977,1976,1975,1974,1973,1972,1971,1970,1969,1968,1967,1966,1965,1964,1963,1962,1961
Estas estatísticas em outros países:
AfghanistanAlbaniaAlgeriaAngolaAntigua and BarbudaArab WorldArgentinaArmeniaArubaAustraliaAustriaAzerbaijanBahamas, TheBahrainBangladeshBarbadosBelarusBelgiumBelizeBeninBermudaBhutanBoliviaBosnia and HerzegovinaBotswanaBrazilBrunei DarussalamBulgariaBurkina FasoBurundiCabo VerdeCambodiaCameroonCanadaCaribbean small statesCentral African RepublicCentral Europe and the BalticsChadChileChinaColombiaComorosCongo, Dem. Rep.Congo, Rep.Costa RicaCote d'IvoireCroatiaCubaCyprusCzech RepublicDenmarkDjiboutiDominicaDominican RepublicEarly-demographic dividendEast Asia & PacificEast Asia & Pacific (excluding high income)East Asia & Pacific (IDA & IBRD countries)EcuadorEgypt, Arab Rep.El SalvadorEquatorial GuineaEritreaEstoniaEthiopiaEuro areaEurope & Central AsiaEurope & Central Asia (excluding high income)Europe & Central Asia (IDA & IBRD countries)European UnionFaroe IslandsFijiFinlandFragile and conflict affected situationsFranceFrench PolynesiaGabonGambia, TheGeorgiaGermanyGhanaGreeceGreenlandGrenadaGuatemalaGuineaGuinea-BissauGuyanaHaitiHeavily indebted poor countries (HIPC)High incomeHondurasHong Kong SAR, ChinaHungaryIBRD onlyIcelandIDA & IBRD totalIDA blendIDA onlyIDA totalIndiaIndonesiaIran, Islamic Rep.IraqIrelandIsraelItalyJamaicaJapanJordanKazakhstanKenyaKiribatiKorea, Rep.KuwaitKyrgyz RepublicLao PDRLate-demographic dividendLatin America & Caribbean Latin America & Caribbean (excluding high income)Latin America & the Caribbean (IDA & IBRD countries)LatviaLeast developed countries: UN classificationLebanonLesothoLiberiaLibyaLithuaniaLow & middle incomeLow incomeLower middle incomeLuxembourgMacao SAR, ChinaMacedonia, FYRMadagascarMalawiMalaysiaMaldivesMaliMaltaMarshall IslandsMauritaniaMauritiusMexicoMicronesia, Fed. Sts.Middle East & North AfricaMiddle East & North Africa (excluding high income)Middle East & North Africa (IDA & IBRD countries)Middle incomeMoldovaMongoliaMontenegroMoroccoMozambiqueMyanmarNamibiaNepalNetherlandsNew CaledoniaNew ZealandNicaraguaNigerNigeriaNorth AmericaNorwayOECD membersOmanOther small statesPacific island small statesPakistanPalauPanamaPapua New GuineaParaguayPeruPhilippinesPolandPortugalPost-demographic dividendPre-demographic dividendQatarRomaniaRussian FederationRwandaSamoaSao Tome and PrincipeSaudi ArabiaSenegalSerbiaSeychellesSierra LeoneSingaporeSlovak RepublicSloveniaSmall statesSolomon IslandsSouth AfricaSouth AsiaSouth Asia (IDA & IBRD)SpainSri LankaSt. Kitts and NevisSt. LuciaSt. Vincent and the GrenadinesSub-Saharan Africa Sub-Saharan Africa (excluding high income)Sub-Saharan Africa (IDA & IBRD countries)SudanSurinameSwazilandSwedenSwitzerlandSyrian Arab RepublicTajikistanTanzaniaThailandTimor-LesteTogoTongaTrinidad and TobagoTunisiaTurkeyTurkmenistanTuvaluUgandaUkraineUnited Arab EmiratesUnited KingdomUnited StatesUpper middle incomeUruguayUzbekistanVanuatuVenezuela, RBVietnamWorldYemen, Rep.ZambiaZimbabwe Linha do tempo:
Nesta escala de tempo está apresentado um gráfico de 1961 ano até 2016 ano Upper middle income. Dados de 1960 ano ausente. O número de observações reais por data: 56.
Fonte (nome):
Indicadores de desenvolvimento mundial
Fonte (organização):
World Trade Organization, and World Bank GDP estimates.
Categorias:
Private Sector, Trade
Foi atualizado:
23 abr 2017 ano
Indicadores de alterações dos valores ao longo dos anos
Mínimo:
17.536
1 jan 1973 ano
Máximo:
56.047
1 jan 2007 ano
Na data de observação
Valor
Mudança absoluta
A alteração em relação ao valor anterior
1 jan 1961 ano
19.988
+19.988
0.0%
1 jan 1962 ano
20.826
+0.837
4.19%
1 jan 1963 ano
20.34
-0.485
-2.33%
1 jan 1964 ano
20.25
-0.091
-0.45%
1 jan 1965 ano
20.036
-0.214
-1.06%
1 jan 1966 ano
18.641
-1.395
-6.96%
1 jan 1967 ano
17.817
-0.823
-4.42%
1 jan 1968 ano
18.567
+0.75
4.21%
1 jan 1969 ano
19.067
+0.5
2.69%
1 jan 1970 ano
18.453
-0.614
-3.22%
1 jan 1971 ano
18.988
+0.535
2.9%
1 jan 1972 ano
19.107
+0.119
0.63%
1 jan 1973 ano
17.536
-1.571
-8.22%
1 jan 1974 ano
19.004
+1.468
8.37%
1 jan 1975 ano
25.534
+6.53
34.36%
1 jan 1976 ano
25.791
+0.257
1.01%
1 jan 1977 ano
25.355
-0.436
-1.69%
1 jan 1978 ano
26.059
+0.703
2.77%
1 jan 1979 ano
28.161
+2.102
8.07%
1 jan 1980 ano
29.324
+1.163
4.13%
1 jan 1981 ano
36.245
+6.921
23.6%
1 jan 1982 ano
35.163
-1.081
-2.98%
1 jan 1983 ano
32.46
-2.704
-7.69%
1 jan 1984 ano
29.33
-3.13
-9.64%
1 jan 1985 ano
30.749
+1.419
4.84%
1 jan 1986 ano
29.028
-1.721
-5.6%
1 jan 1987 ano
26.339
-2.689
-9.26%
1 jan 1988 ano
30.415
+4.076
15.48%
1 jan 1989 ano
32.072
+1.658
5.45%
1 jan 1990 ano
32.699
+0.627
1.95%
1 jan 1991 ano
29.898
-2.802
-8.57%
1 jan 1992 ano
29.635
-0.262
-0.88%
1 jan 1993 ano
33.453
+3.818
12.88%
1 jan 1994 ano
34.057
+0.603
1.8%
1 jan 1995 ano
34.517
+0.46
1.35%
1 jan 1996 ano
37.057
+2.54
7.36%
1 jan 1997 ano
36.842
-0.215
-0.58%
1 jan 1998 ano
37.263
+0.422
1.14%
1 jan 1999 ano
35.568
-1.695
-4.55%
1 jan 2000 ano
38.971
+3.403
9.57%
1 jan 2001 ano
43.63
+4.659
11.95%
1 jan 2002 ano
42.958
-0.671
-1.54%
1 jan 2003 ano
46.231
+3.273
7.62%
1 jan 2004 ano
50.023
+3.792
8.2%
1 jan 2005 ano
54.414
+4.391
8.78%
1 jan 2006 ano
55.18
+0.766
1.41%
1 jan 2007 ano
56.047
+0.867
1.57%
1 jan 2008 ano
54.244
-1.803
-3.22%
1 jan 2009 ano
53.802
-0.443
-0.82%
1 jan 2010 ano
43.724
-10.077
-18.73%
1 jan 2011 ano
46.891
+3.166
7.24%
1 jan 2012 ano
48.088
+1.198
2.55%
1 jan 2013 ano
46.776
-1.313
-2.73%
1 jan 2014 ano
45.401
-1.374
-2.94%
1 jan 2015 ano
44.576
-0.826
-1.82%
1 jan 2016 ano
41.764
-2.812
-6.31%
Classificação de países por estatísticas atuais por anos


Comentários: