29
/pt/
pt
AIzaSyAYiBZKx7MnpbEhh9jyipgxe19OcubqV5w
April 1, 2024
137011
Gambia, The
GMB
true
2
1
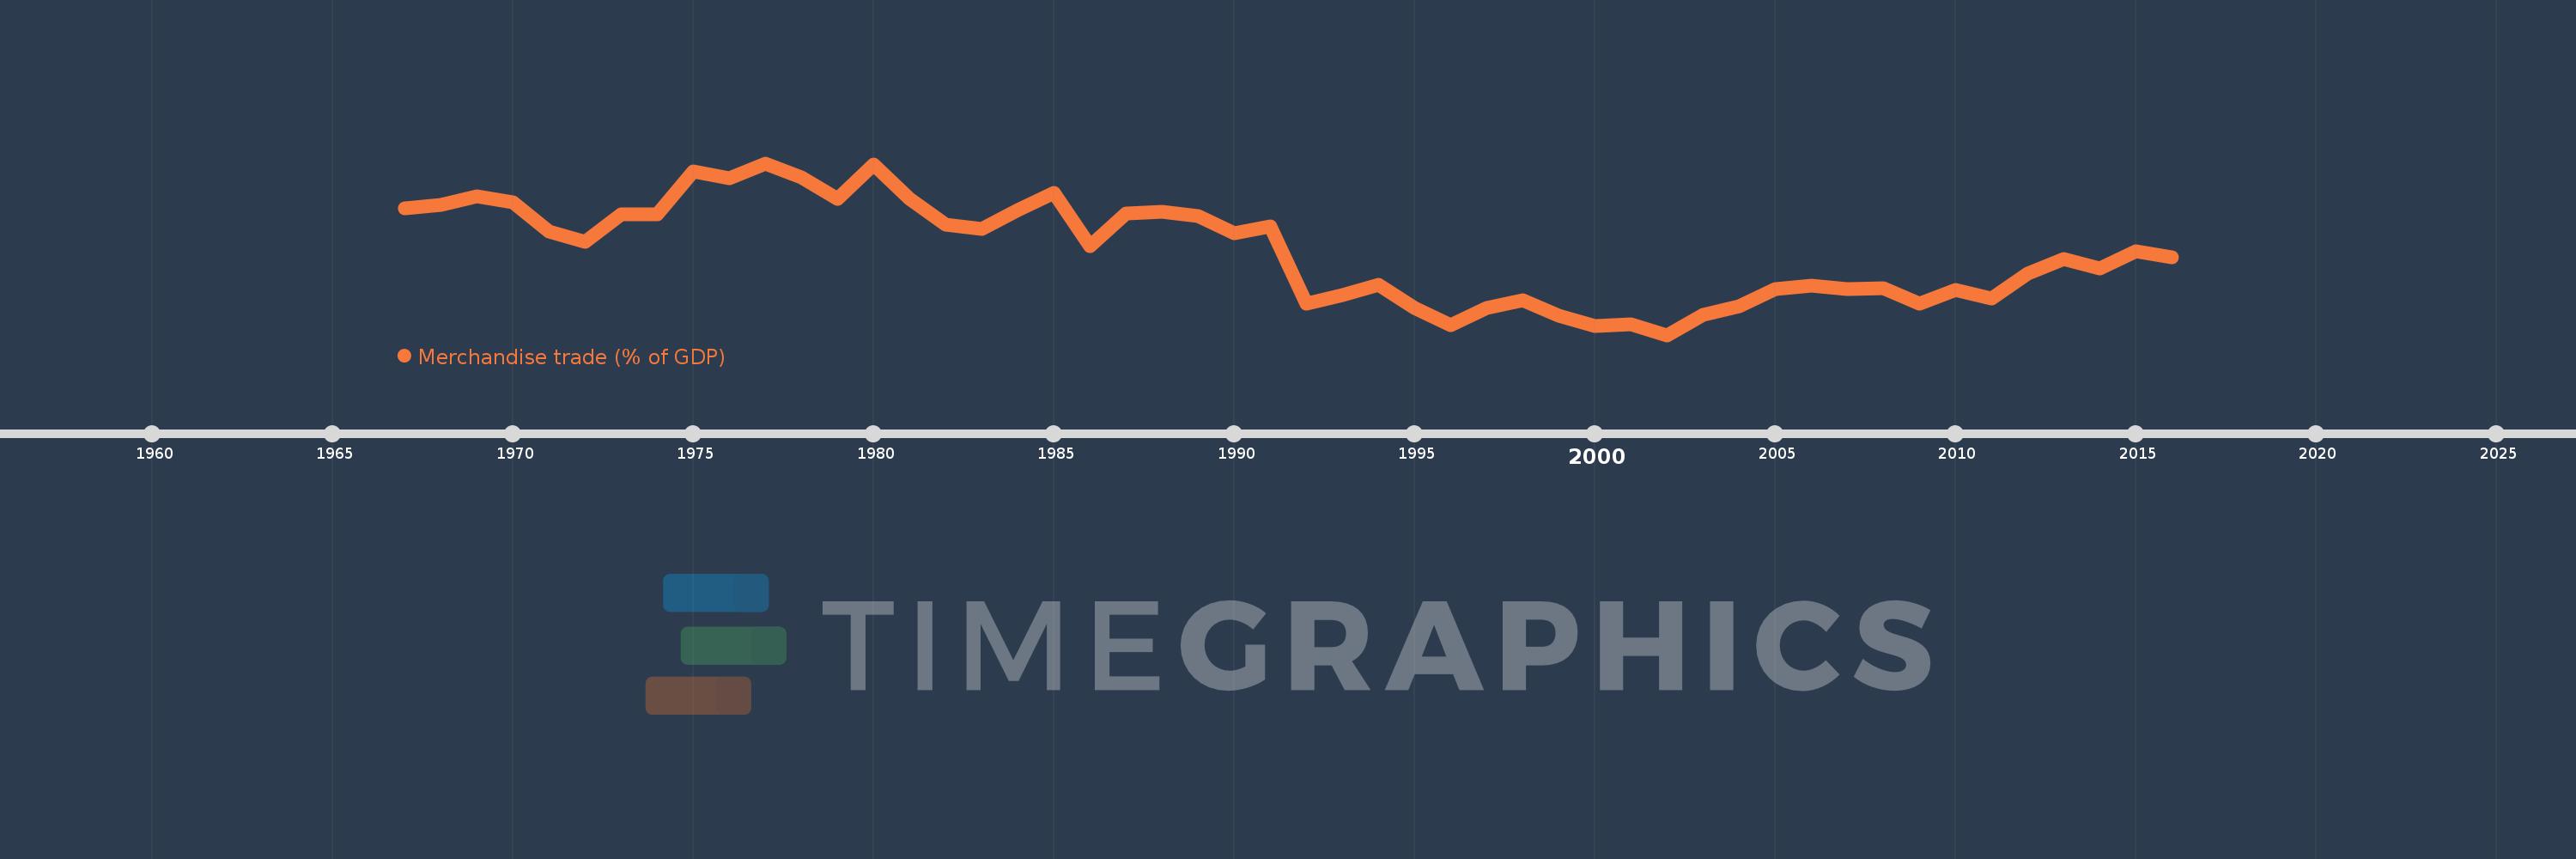
Merchandise trade (% of GDP)
2016,2015,2014,2013,2012,2011,2010,2009,2008,2007,2006,2005,2004,2003,2002,2001,2000,1999,1998,1997,1996,1995,1994,1993,1992,1991,1990,1989,1988,1987,1986,1985,1984,1983,1982,1981,1980,1979,1978,1977,1976,1975,1974,1973,1972,1971,1970,1969,1968,1967
Estas estatísticas em outros países:
AfghanistanAlbaniaAlgeriaAngolaAntigua and BarbudaArab WorldArgentinaArmeniaArubaAustraliaAustriaAzerbaijanBahamas, TheBahrainBangladeshBarbadosBelarusBelgiumBelizeBeninBermudaBhutanBoliviaBosnia and HerzegovinaBotswanaBrazilBrunei DarussalamBulgariaBurkina FasoBurundiCabo VerdeCambodiaCameroonCanadaCaribbean small statesCentral African RepublicCentral Europe and the BalticsChadChileChinaColombiaComorosCongo, Dem. Rep.Congo, Rep.Costa RicaCote d'IvoireCroatiaCubaCyprusCzech RepublicDenmarkDjiboutiDominicaDominican RepublicEarly-demographic dividendEast Asia & PacificEast Asia & Pacific (excluding high income)East Asia & Pacific (IDA & IBRD countries)EcuadorEgypt, Arab Rep.El SalvadorEquatorial GuineaEritreaEstoniaEthiopiaEuro areaEurope & Central AsiaEurope & Central Asia (excluding high income)Europe & Central Asia (IDA & IBRD countries)European UnionFaroe IslandsFijiFinlandFragile and conflict affected situationsFranceFrench PolynesiaGabonGambia, TheGeorgiaGermanyGhanaGreeceGreenlandGrenadaGuatemalaGuineaGuinea-BissauGuyanaHaitiHeavily indebted poor countries (HIPC)High incomeHondurasHong Kong SAR, ChinaHungaryIBRD onlyIcelandIDA & IBRD totalIDA blendIDA onlyIDA totalIndiaIndonesiaIran, Islamic Rep.IraqIrelandIsraelItalyJamaicaJapanJordanKazakhstanKenyaKiribatiKorea, Rep.KuwaitKyrgyz RepublicLao PDRLate-demographic dividendLatin America & Caribbean Latin America & Caribbean (excluding high income)Latin America & the Caribbean (IDA & IBRD countries)LatviaLeast developed countries: UN classificationLebanonLesothoLiberiaLibyaLithuaniaLow & middle incomeLow incomeLower middle incomeLuxembourgMacao SAR, ChinaMacedonia, FYRMadagascarMalawiMalaysiaMaldivesMaliMaltaMarshall IslandsMauritaniaMauritiusMexicoMicronesia, Fed. Sts.Middle East & North AfricaMiddle East & North Africa (excluding high income)Middle East & North Africa (IDA & IBRD countries)Middle incomeMoldovaMongoliaMontenegroMoroccoMozambiqueMyanmarNamibiaNepalNetherlandsNew CaledoniaNew ZealandNicaraguaNigerNigeriaNorth AmericaNorwayOECD membersOmanOther small statesPacific island small statesPakistanPalauPanamaPapua New GuineaParaguayPeruPhilippinesPolandPortugalPost-demographic dividendPre-demographic dividendQatarRomaniaRussian FederationRwandaSamoaSao Tome and PrincipeSaudi ArabiaSenegalSerbiaSeychellesSierra LeoneSingaporeSlovak RepublicSloveniaSmall statesSolomon IslandsSouth AfricaSouth AsiaSouth Asia (IDA & IBRD)SpainSri LankaSt. Kitts and NevisSt. LuciaSt. Vincent and the GrenadinesSub-Saharan Africa Sub-Saharan Africa (excluding high income)Sub-Saharan Africa (IDA & IBRD countries)SudanSurinameSwazilandSwedenSwitzerlandSyrian Arab RepublicTajikistanTanzaniaThailandTimor-LesteTogoTongaTrinidad and TobagoTunisiaTurkeyTurkmenistanTuvaluUgandaUkraineUnited Arab EmiratesUnited KingdomUnited StatesUpper middle incomeUruguayUzbekistanVanuatuVenezuela, RBVietnamWorldYemen, Rep.ZambiaZimbabwe Linha do tempo:
Nesta escala de tempo está apresentado um gráfico de 1967 ano até 2016 ano Gambia, The. Dados de 1966 ano ausente. O número de observações reais por data: 50.
Fonte (nome):
Indicadores de desenvolvimento mundial
Fonte (organização):
World Trade Organization, and World Bank GDP estimates.
Categorias:
Private Sector, Trade
Foi atualizado:
23 abr 2017 ano
Indicadores de alterações dos valores ao longo dos anos
Mínimo:
20.948
1 jan 2002 ano
Máximo:
97.011
1 jan 1977 ano
Na data de observação
Valor
Mudança absoluta
A alteração em relação ao valor anterior
1 jan 1967 ano
77.137
+77.137
0.0%
1 jan 1968 ano
78.687
+1.55
2.01%
1 jan 1969 ano
82.518
+3.831
4.87%
1 jan 1970 ano
79.712
-2.806
-3.4%
1 jan 1971 ano
66.589
-13.123
-16.46%
1 jan 1972 ano
62.319
-4.27
-6.41%
1 jan 1973 ano
74.338
+12.019
19.29%
1 jan 1974 ano
74.541
+0.203
0.27%
1 jan 1975 ano
93.402
+18.86
25.3%
1 jan 1976 ano
90.207
-3.195
-3.42%
1 jan 1977 ano
97.011
+6.804
7.54%
1 jan 1978 ano
90.57
-6.441
-6.64%
1 jan 1979 ano
81.257
-9.314
-10.28%
1 jan 1980 ano
96.252
+14.995
18.45%
1 jan 1981 ano
81.301
-14.951
-15.53%
1 jan 1982 ano
69.938
-11.362
-13.98%
1 jan 1983 ano
68.039
-1.899
-2.72%
1 jan 1984 ano
76.366
+8.326
12.24%
1 jan 1985 ano
84.02
+7.654
10.02%
1 jan 1986 ano
60.25
-23.77
-28.29%
1 jan 1987 ano
74.874
+14.623
24.27%
1 jan 1988 ano
75.694
+0.82
1.1%
1 jan 1989 ano
73.498
-2.195
-2.9%
1 jan 1990 ano
66.169
-7.329
-9.97%
1 jan 1991 ano
69.067
+2.898
4.38%
1 jan 1992 ano
34.767
-34.3
-49.66%
1 jan 1993 ano
38.502
+3.735
10.74%
1 jan 1994 ano
43.309
+4.807
12.49%
1 jan 1995 ano
33.088
-10.221
-23.6%
1 jan 1996 ano
25.191
-7.897
-23.87%
1 jan 1997 ano
32.892
+7.701
30.57%
1 jan 1998 ano
36.46
+3.568
10.85%
1 jan 1999 ano
29.633
-6.827
-18.72%
1 jan 2000 ano
25.039
-4.594
-15.5%
1 jan 2001 ano
25.801
+0.762
3.04%
1 jan 2002 ano
20.948
-4.853
-18.81%
1 jan 2003 ano
29.851
+8.903
42.5%
1 jan 2004 ano
33.77
+3.919
13.13%
1 jan 2005 ano
41.271
+7.501
22.21%
1 jan 2006 ano
42.783
+1.512
3.66%
1 jan 2007 ano
41.332
-1.452
-3.39%
1 jan 2008 ano
41.844
+0.512
1.24%
1 jan 2009 ano
34.779
-7.066
-16.89%
1 jan 2010 ano
41.066
+6.288
18.08%
1 jan 2011 ano
37.097
-3.97
-9.67%
1 jan 2012 ano
48.169
+11.073
29.85%
1 jan 2013 ano
54.667
+6.498
13.49%
1 jan 2014 ano
50.505
-4.163
-7.61%
1 jan 2015 ano
57.848
+7.344
14.54%
1 jan 2016 ano
55.21
-2.638
-4.56%
Classificação de países por estatísticas atuais por anos


Comentários: