29
/pt/
pt
AIzaSyAYiBZKx7MnpbEhh9jyipgxe19OcubqV5w
April 1, 2024
195859
Mexico
MEX
true
2
1
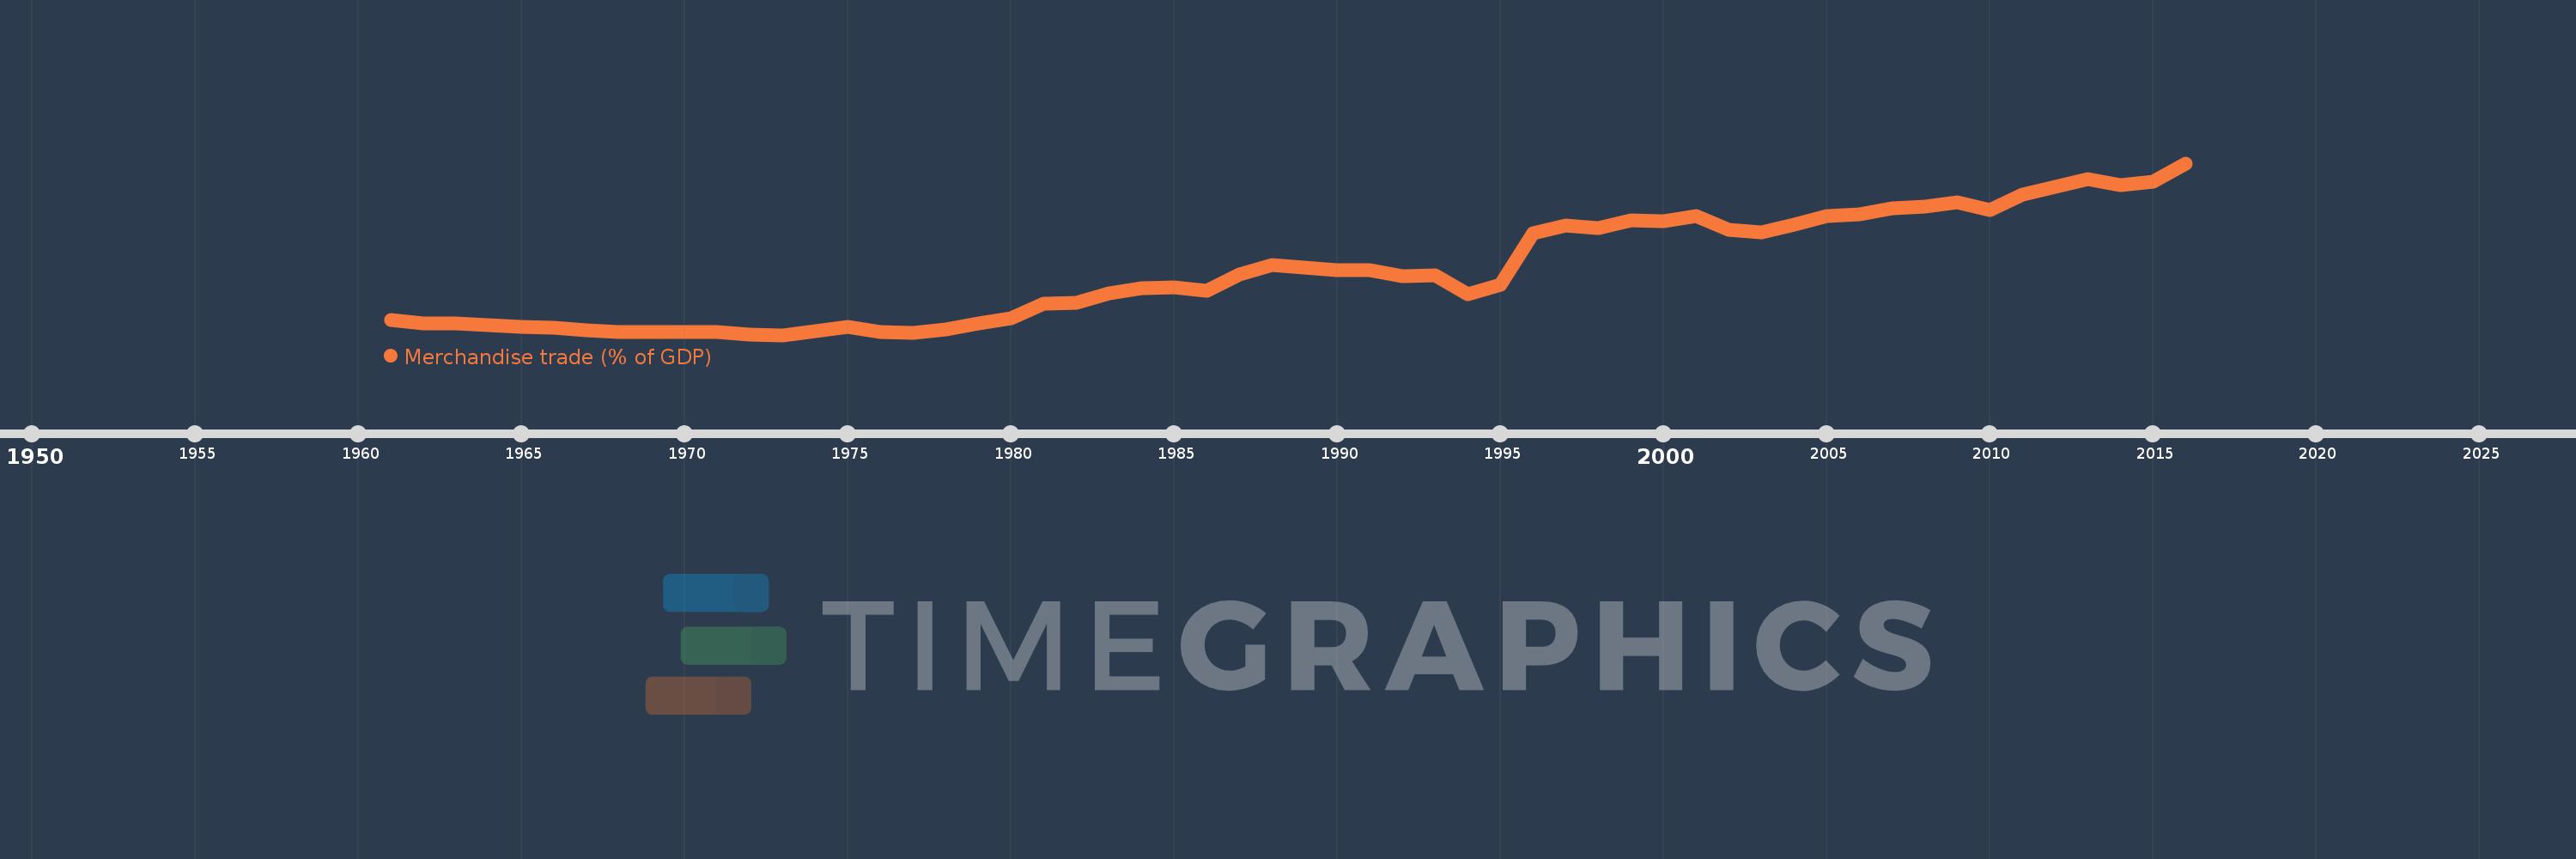
Merchandise trade (% of GDP)
2016,2015,2014,2013,2012,2011,2010,2009,2008,2007,2006,2005,2004,2003,2002,2001,2000,1999,1998,1997,1996,1995,1994,1993,1992,1991,1990,1989,1988,1987,1986,1985,1984,1983,1982,1981,1980,1979,1978,1977,1976,1975,1974,1973,1972,1971,1970,1969,1968,1967,1966,1965,1964,1963,1962,1961
Estas estatísticas em outros países:
AfghanistanAlbaniaAlgeriaAngolaAntigua and BarbudaArab WorldArgentinaArmeniaArubaAustraliaAustriaAzerbaijanBahamas, TheBahrainBangladeshBarbadosBelarusBelgiumBelizeBeninBermudaBhutanBoliviaBosnia and HerzegovinaBotswanaBrazilBrunei DarussalamBulgariaBurkina FasoBurundiCabo VerdeCambodiaCameroonCanadaCaribbean small statesCentral African RepublicCentral Europe and the BalticsChadChileChinaColombiaComorosCongo, Dem. Rep.Congo, Rep.Costa RicaCote d'IvoireCroatiaCubaCyprusCzech RepublicDenmarkDjiboutiDominicaDominican RepublicEarly-demographic dividendEast Asia & PacificEast Asia & Pacific (excluding high income)East Asia & Pacific (IDA & IBRD countries)EcuadorEgypt, Arab Rep.El SalvadorEquatorial GuineaEritreaEstoniaEthiopiaEuro areaEurope & Central AsiaEurope & Central Asia (excluding high income)Europe & Central Asia (IDA & IBRD countries)European UnionFaroe IslandsFijiFinlandFragile and conflict affected situationsFranceFrench PolynesiaGabonGambia, TheGeorgiaGermanyGhanaGreeceGreenlandGrenadaGuatemalaGuineaGuinea-BissauGuyanaHaitiHeavily indebted poor countries (HIPC)High incomeHondurasHong Kong SAR, ChinaHungaryIBRD onlyIcelandIDA & IBRD totalIDA blendIDA onlyIDA totalIndiaIndonesiaIran, Islamic Rep.IraqIrelandIsraelItalyJamaicaJapanJordanKazakhstanKenyaKiribatiKorea, Rep.KuwaitKyrgyz RepublicLao PDRLate-demographic dividendLatin America & Caribbean Latin America & Caribbean (excluding high income)Latin America & the Caribbean (IDA & IBRD countries)LatviaLeast developed countries: UN classificationLebanonLesothoLiberiaLibyaLithuaniaLow & middle incomeLow incomeLower middle incomeLuxembourgMacao SAR, ChinaMacedonia, FYRMadagascarMalawiMalaysiaMaldivesMaliMaltaMarshall IslandsMauritaniaMauritiusMexicoMicronesia, Fed. Sts.Middle East & North AfricaMiddle East & North Africa (excluding high income)Middle East & North Africa (IDA & IBRD countries)Middle incomeMoldovaMongoliaMontenegroMoroccoMozambiqueMyanmarNamibiaNepalNetherlandsNew CaledoniaNew ZealandNicaraguaNigerNigeriaNorth AmericaNorwayOECD membersOmanOther small statesPacific island small statesPakistanPalauPanamaPapua New GuineaParaguayPeruPhilippinesPolandPortugalPost-demographic dividendPre-demographic dividendQatarRomaniaRussian FederationRwandaSamoaSao Tome and PrincipeSaudi ArabiaSenegalSerbiaSeychellesSierra LeoneSingaporeSlovak RepublicSloveniaSmall statesSolomon IslandsSouth AfricaSouth AsiaSouth Asia (IDA & IBRD)SpainSri LankaSt. Kitts and NevisSt. LuciaSt. Vincent and the GrenadinesSub-Saharan Africa Sub-Saharan Africa (excluding high income)Sub-Saharan Africa (IDA & IBRD countries)SudanSurinameSwazilandSwedenSwitzerlandSyrian Arab RepublicTajikistanTanzaniaThailandTimor-LesteTogoTongaTrinidad and TobagoTunisiaTurkeyTurkmenistanTuvaluUgandaUkraineUnited Arab EmiratesUnited KingdomUnited StatesUpper middle incomeUruguayUzbekistanVanuatuVenezuela, RBVietnamWorldYemen, Rep.ZambiaZimbabwe Linha do tempo:
Nesta escala de tempo está apresentado um gráfico de 1961 ano até 2016 ano Mexico. Dados de 1960 ano ausente. O número de observações reais por data: 56.
Fonte (nome):
Indicadores de desenvolvimento mundial
Fonte (organização):
World Trade Organization, and World Bank GDP estimates.
Categorias:
Private Sector, Trade
Foi atualizado:
23 abr 2017 ano
Indicadores de alterações dos valores ao longo dos anos
Mínimo:
9.767
1 jan 1973 ano
Máximo:
68.723
1 jan 2016 ano
Na data de observação
Valor
Mudança absoluta
A alteração em relação ao valor anterior
1 jan 1961 ano
14.937
+14.937
0.0%
1 jan 1962 ano
13.881
-1.057
-7.07%
1 jan 1963 ano
13.619
-0.261
-1.88%
1 jan 1964 ano
13.134
-0.485
-3.56%
1 jan 1965 ano
12.689
-0.445
-3.39%
1 jan 1966 ano
12.392
-0.297
-2.34%
1 jan 1967 ano
11.521
-0.871
-7.03%
1 jan 1968 ano
10.894
-0.627
-5.44%
1 jan 1969 ano
10.946
+0.051
0.47%
1 jan 1970 ano
10.795
-0.151
-1.38%
1 jan 1971 ano
10.868
+0.074
0.68%
1 jan 1972 ano
9.978
-0.891
-8.19%
1 jan 1973 ano
9.767
-0.21
-2.11%
1 jan 1974 ano
10.971
+1.203
12.32%
1 jan 1975 ano
12.524
+1.553
14.16%
1 jan 1976 ano
10.777
-1.747
-13.95%
1 jan 1977 ano
10.61
-0.166
-1.54%
1 jan 1978 ano
11.801
+1.191
11.22%
1 jan 1979 ano
13.767
+1.966
16.66%
1 jan 1980 ano
15.659
+1.892
13.74%
1 jan 1981 ano
20.671
+5.012
32.01%
1 jan 1982 ano
20.701
+0.03
0.15%
1 jan 1983 ano
24.06
+3.359
16.23%
1 jan 1984 ano
25.814
+1.754
7.29%
1 jan 1985 ano
26.073
+0.258
1.0%
1 jan 1986 ano
24.867
-1.206
-4.62%
1 jan 1987 ano
30.421
+5.554
22.33%
1 jan 1988 ano
33.72
+3.299
10.84%
1 jan 1989 ano
32.812
-0.908
-2.69%
1 jan 1990 ano
32.098
-0.714
-2.18%
1 jan 1991 ano
32.073
-0.025
-0.08%
1 jan 1992 ano
30.024
-2.049
-6.39%
1 jan 1993 ano
30.365
+0.34
1.13%
1 jan 1994 ano
23.699
-6.666
-21.95%
1 jan 1995 ano
27.093
+3.394
14.32%
1 jan 1996 ano
44.786
+17.692
65.3%
1 jan 1997 ano
47.302
+2.516
5.62%
1 jan 1998 ano
46.519
-0.782
-1.65%
1 jan 1999 ano
49.109
+2.59
5.57%
1 jan 2000 ano
48.748
-0.361
-0.74%
1 jan 2001 ano
50.586
+1.838
3.77%
1 jan 2002 ano
45.755
-4.831
-9.55%
1 jan 2003 ano
45.009
-0.746
-1.63%
1 jan 2004 ano
47.728
+2.719
6.04%
1 jan 2005 ano
50.663
+2.935
6.15%
1 jan 2006 ano
51.071
+0.408
0.8%
1 jan 2007 ano
53.19
+2.12
4.15%
1 jan 2008 ano
53.865
+0.675
1.27%
1 jan 2009 ano
55.351
+1.486
2.76%
1 jan 2010 ano
52.654
-2.697
-4.87%
1 jan 2011 ano
57.891
+5.237
9.95%
1 jan 2012 ano
60.677
+2.785
4.81%
1 jan 2013 ano
63.311
+2.634
4.34%
1 jan 2014 ano
61.093
-2.218
-3.5%
1 jan 2015 ano
62.296
+1.203
1.97%
1 jan 2016 ano
68.723
+6.427
10.32%
Classificação de países por estatísticas atuais por anos


Comentários: